method and records
Uncertainty of Measurement in Practice
Why every result is a range rather than a number, how Type A and Type B contributions differ, a worked uncertainty budget for a weighing and a dilution, the coverage factor and reporting convention, and what a purity figure quoted without uncertainty is actually worth.
Every measurement result is an interval, not a point. The number reported is the best estimate of a quantity whose true value is unknown, and stating that number without stating how wide the interval around it is leaves the reader unable to do the one thing results exist for: comparing them with something else. This page covers where the interval comes from, how to build a usable budget for the two operations a small laboratory performs constantly — a weighing and a dilution — how to report the answer, and what it implies about a purity figure printed on a certificate with no uncertainty beside it.
Why every result is a range
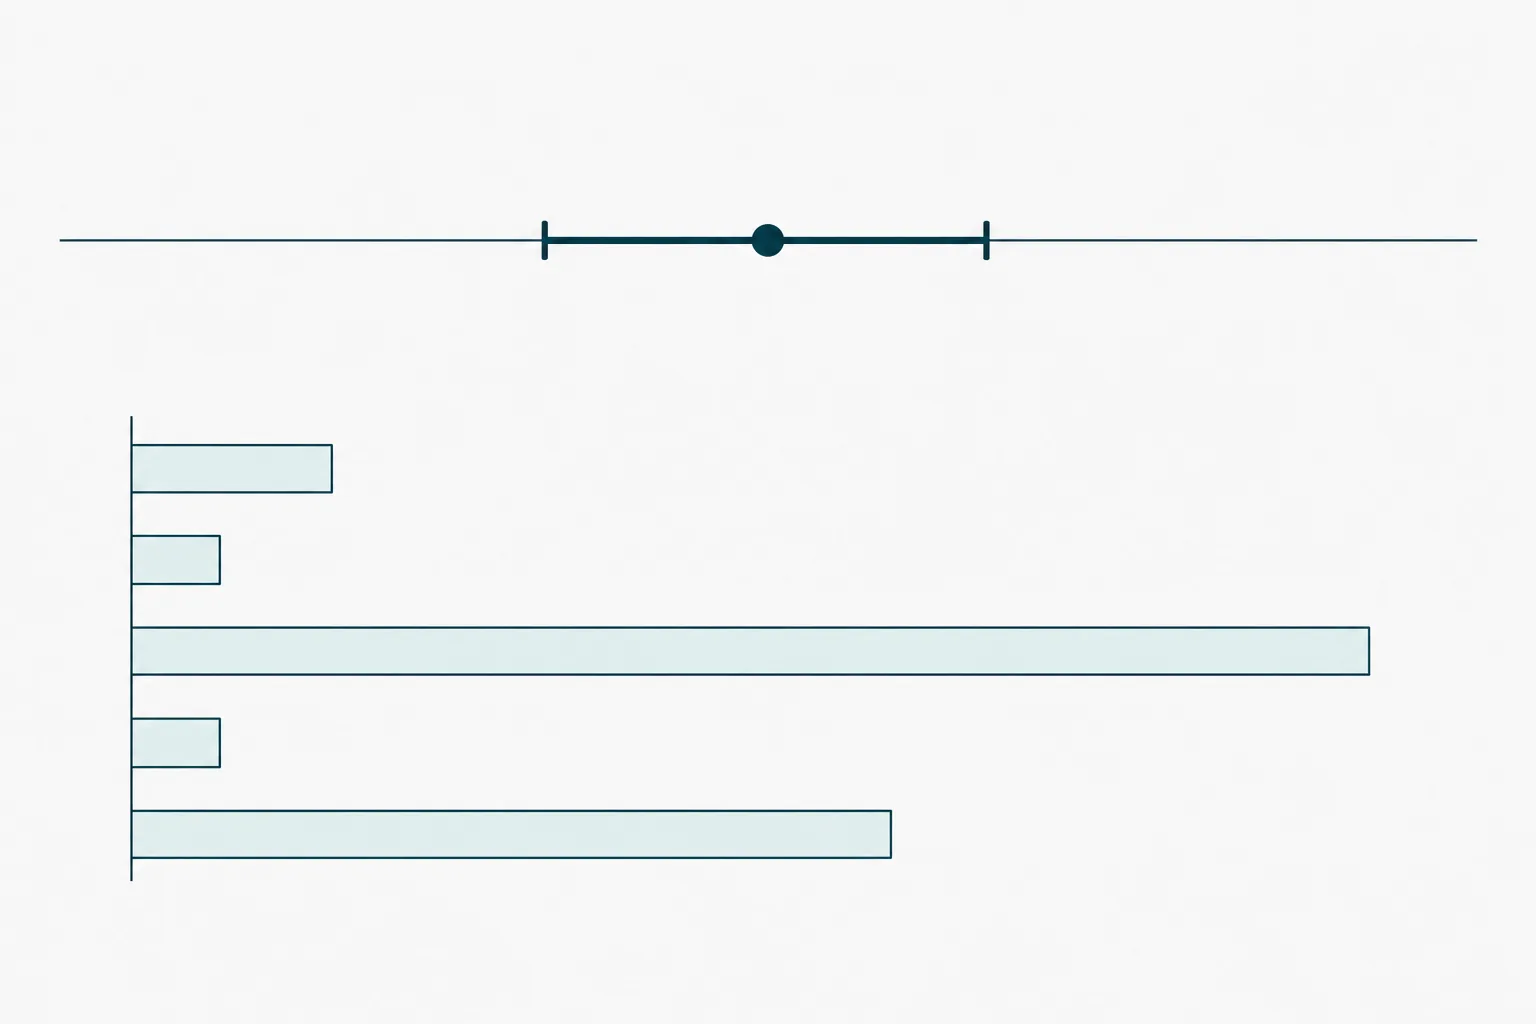
Uncertainty is not error and it is not a mistake. Error is the difference between a result and the true value, and it is unknowable because the true value is unknowable. Uncertainty is a characterisation of the range within which the true value can reasonably be said to lie, given everything known about how the result was produced 1. A laboratory can eliminate mistakes. It cannot eliminate uncertainty, and a stated uncertainty of zero is a statement that nobody looked.
The practical consequence appears the moment a result meets a limit. A concentration of 0.82 milligrams per millilitre against a requirement of not less than 0.80 looks compliant. If the expanded uncertainty is plus or minus 0.04, the true value plausibly lies anywhere between 0.78 and 0.86, and the measurement does not resolve the question being asked of it. Nothing about the arithmetic reveals this; only the budget does. Conformity decisions taken against a limit without regard to uncertainty are decisions taken on incomplete information, which is why the requirement to evaluate uncertainty sits alongside the requirement to report results at all 4.
The second consequence is comparison. Two purity figures differing by half a per cent are the same figure if the method carries an expanded uncertainty of one per cent. Most disputes between a laboratory and a supplier, and a good proportion of investigations into apparent drift, dissolve on contact with this observation.
Type A and Type B contributions
The two categories describe how a contribution was quantified, and nothing else. A Type A evaluation comes from the statistical treatment of repeated observations: weigh the same object ten times, take the standard deviation, and that is a Type A standard uncertainty. A Type B evaluation comes from any other source — a calibration certificate, a manufacturer tolerance, a published value, a reasoned estimate based on experience 3.
The distinction is routinely misread as a hierarchy in which Type A is real data and Type B is guesswork. It is not. A calibration certificate traceable to a national standard is a Type B input and is far more reliable than a Type A standard deviation calculated from three replicates. Both types are treated identically once converted to standard uncertainties, and the classification exists only so that a budget can be read and audited 1.
Conversion is the step that trips people. A Type A figure is already a standard deviation and needs nothing done to it. A Type B figure usually arrives as a half-width — plus or minus something — and must be divided by a factor reflecting the assumed distribution before it can be combined.
| Source | Assumed distribution | Divide half-width by |
|---|---|---|
| Manufacturer tolerance, no other information | Rectangular | The square root of 3, about 1.73 |
| Volumetric glassware tolerance, value most likely near centre | Triangular | The square root of 6, about 2.45 |
| Calibration certificate quoting k = 2 | Normal | 2 |
| Repeated observations | Not applicable, already a standard deviation | Nothing |
A worked budget: weighing and dilution
Take the operation a laboratory performs most often. Ten milligrams of a lyophilised peptide solid is weighed on a five-place balance and dissolved to ten millilitres in a Class A volumetric flask, giving a gross concentration of 1.000 milligrams per millilitre. The certificate states net peptide content of 82 per cent and no uncertainty against it, so the corrected concentration is 0.820 milligrams per millilitre. Every contribution below is expressed as a relative standard uncertainty, so that they can be combined directly.
| Contribution | Type | Input value | Distribution | Relative standard uncertainty |
|---|---|---|---|---|
| Balance repeatability | A | sd 0.02 mg from 10 replicate weighings | Not applicable | 0.20 per cent |
| Balance calibration | B | plus or minus 0.03 mg from certificate | Rectangular | 0.17 per cent |
| Residual moisture on the solid | B | plus or minus 2 per cent of mass, estimated | Rectangular | 1.15 per cent |
| Flask tolerance, 10 mL Class A | B | plus or minus 0.02 mL | Triangular | 0.08 per cent |
| Temperature, 20 plus or minus 3 degrees Celsius | B | plus or minus 0.006 mL by thermal expansion | Rectangular | 0.04 per cent |
| Fill repeatability to the mark | A | sd 0.005 mL | Not applicable | 0.05 per cent |
| Net peptide content | B | 82 per cent, plus or minus 3 per cent absolute assumed | Rectangular | 2.11 per cent |
| Combined standard uncertainty | Root of the sum of the squares | 2.42 per cent | ||
| Expanded uncertainty, k = 2 | Approximately 95 per cent coverage | 4.8 per cent |
The result is reported as 0.82 milligrams per millilitre with an expanded uncertainty of 0.04 milligrams per millilitre, k equal to 2. Read the budget rather than the answer, though, because the shape of it is the lesson. The balance and the glassware — the equipment people worry about, buy carefully and have serviced — contribute almost nothing between them. Two terms dominate, and both are properties of the solid rather than of any instrument: residual moisture and net peptide content. Together they account for more than 98 per cent of the combined variance.
This is the ordinary shape of an analytical budget, and it has a direct operational reading. Buying a better balance would improve this result by nothing measurable. Obtaining a net peptide content figure with a stated uncertainty, or determining moisture content directly, would cut the interval by more than half. A budget is worth constructing not for the final number but because it tells you which single change is worth making, and it very often contradicts what the laboratory assumed 2.
Coverage factor and reporting convention
The combined standard uncertainty is roughly a one-standard-deviation interval, covering about 68 per cent of plausible values. That is too narrow for most practical purposes, so it is multiplied by a coverage factor, k, to give an expanded uncertainty. A coverage factor of 2 corresponds to approximately 95 per cent coverage and is the near-universal convention; k equal to 3 gives about 99 per cent and is used where the consequence of being wrong is severe 1.
Report four things together and the result is complete: the value, the expanded uncertainty in the same units, the coverage factor, and the approximate level of confidence. A quoted uncertainty with no k value is ambiguous by a factor of two or three, and is therefore of little more use than no uncertainty at all 3.
- State the measurand precisely: what quantity, in what units, on what basis.
- List every contribution you can identify, however small, before evaluating any of them.
- Convert each to a standard uncertainty, dividing Type B half-widths by the appropriate distribution factor.
- Express all contributions in the same terms, relative or absolute, so they can be combined.
- Combine as the square root of the sum of the squares.
- Multiply by the coverage factor, normally 2.
- Round the uncertainty to two significant figures at most, then round the result to match its last digit.
- Report value, expanded uncertainty, coverage factor and confidence level together, and retain the budget itself with the method record.
Rounding deserves the specific mention it gets in that list. A result of 0.8203 with an uncertainty of 0.0402 is reported as 0.82 plus or minus 0.04. Carrying digits the uncertainty cannot support is the most visible way a laboratory advertises that it has not thought about the question, and it is a habit that survives long after the underlying reasoning has been learned.
Reading a purity claim in this light
Return now to the figure most often quoted about research peptide material: purity, stated on a certificate as 99.1 per cent, with no uncertainty and frequently without the conditions under which it was determined. What is that number worth?
It is worth something, but less than its four significant figures imply. A chromatographic purity determined by area normalisation typically carries an intermediate precision of a few tenths of a per cent absolute, giving an expanded uncertainty near one per cent once integration decisions, standard preparation and instrument variation are included. On that basis, 99.1 per cent and 98.3 per cent are not distinguishable results; they are the same result reported twice. A specification of not less than 99 per cent, applied to a figure of 99.1 per cent from such a method, is a coin toss dressed as a decision 2.
There is a second and larger problem the budget above makes visible. Area normalisation reports the proportion of detected material that is the analyte. It says nothing about material the detector cannot see at the chosen wavelength, and nothing whatever about water, residual solvent or counterion, which are not chromatographed and yet form part of the mass on the balance. A solid can be 99 per cent pure by that method and still be well under 80 per cent peptide by mass. The two figures are not in conflict because they are not measuring the same quantity, which is precisely why net peptide content dominated the worked budget.
So the reading is this. A certificate figure quoted without an uncertainty and without its method conditions is not wrong; it is incomplete, in the specific sense that it cannot be compared with anything, including the same laboratory's own figure for the next batch. Treat such a value as a Type B input with an uncertainty you must estimate yourself, record that estimate as an assumption rather than burying it, and carry it through the budget. The alternative — taking the printed figure as exact — does not remove the uncertainty from the result. It only removes it from the record, which is the one place it was doing any good.
References
- JCGM 100:2008 Evaluation of measurement data — Guide to the expression of uncertainty in measurement
- Quantifying Uncertainty in Analytical Measurement, Eurachem/CITAC Guide CG 4, third edition
- Guidelines for Evaluating and Expressing the Uncertainty of NIST Measurement Results, Technical Note 1297
- ISO/IEC 17025:2017 General requirements for the competence of testing and calibration laboratories