analytical method design
ESI-LC-MS Versus MALDI-TOF: Which Mass Measurement Proves What
Two ionisation routes, two kinds of spectrum, and different claims each can support. How electrospray and matrix-assisted laser desorption differ, what mass accuracy in ppm actually requires, and how to choose between them for peptide identity.
Both techniques can confirm that a peptide has the expected mass, but they arrive at that mass differently and support different claims. Electrospray ionisation coupled to liquid chromatography (ESI-LC-MS) separates the sample first and then measures every eluting species, usually as a series of multiply charged ions. Matrix-assisted laser desorption/ionisation with time-of-flight analysis (MALDI-TOF) measures an unseparated spot, usually as a single singly charged ion. For identity plus a view of related impurities, ESI-LC-MS is the stronger measurement. For a fast mass check on a single, reasonably pure species, MALDI-TOF is adequate and quicker.
This page is about choosing and specifying the measurement. How to read a reported mass once it exists — deconvolution, monoisotopic against average mass, adduct offsets — is covered in the handbook's article on mass spectrometry and identity, and is not repeated here.
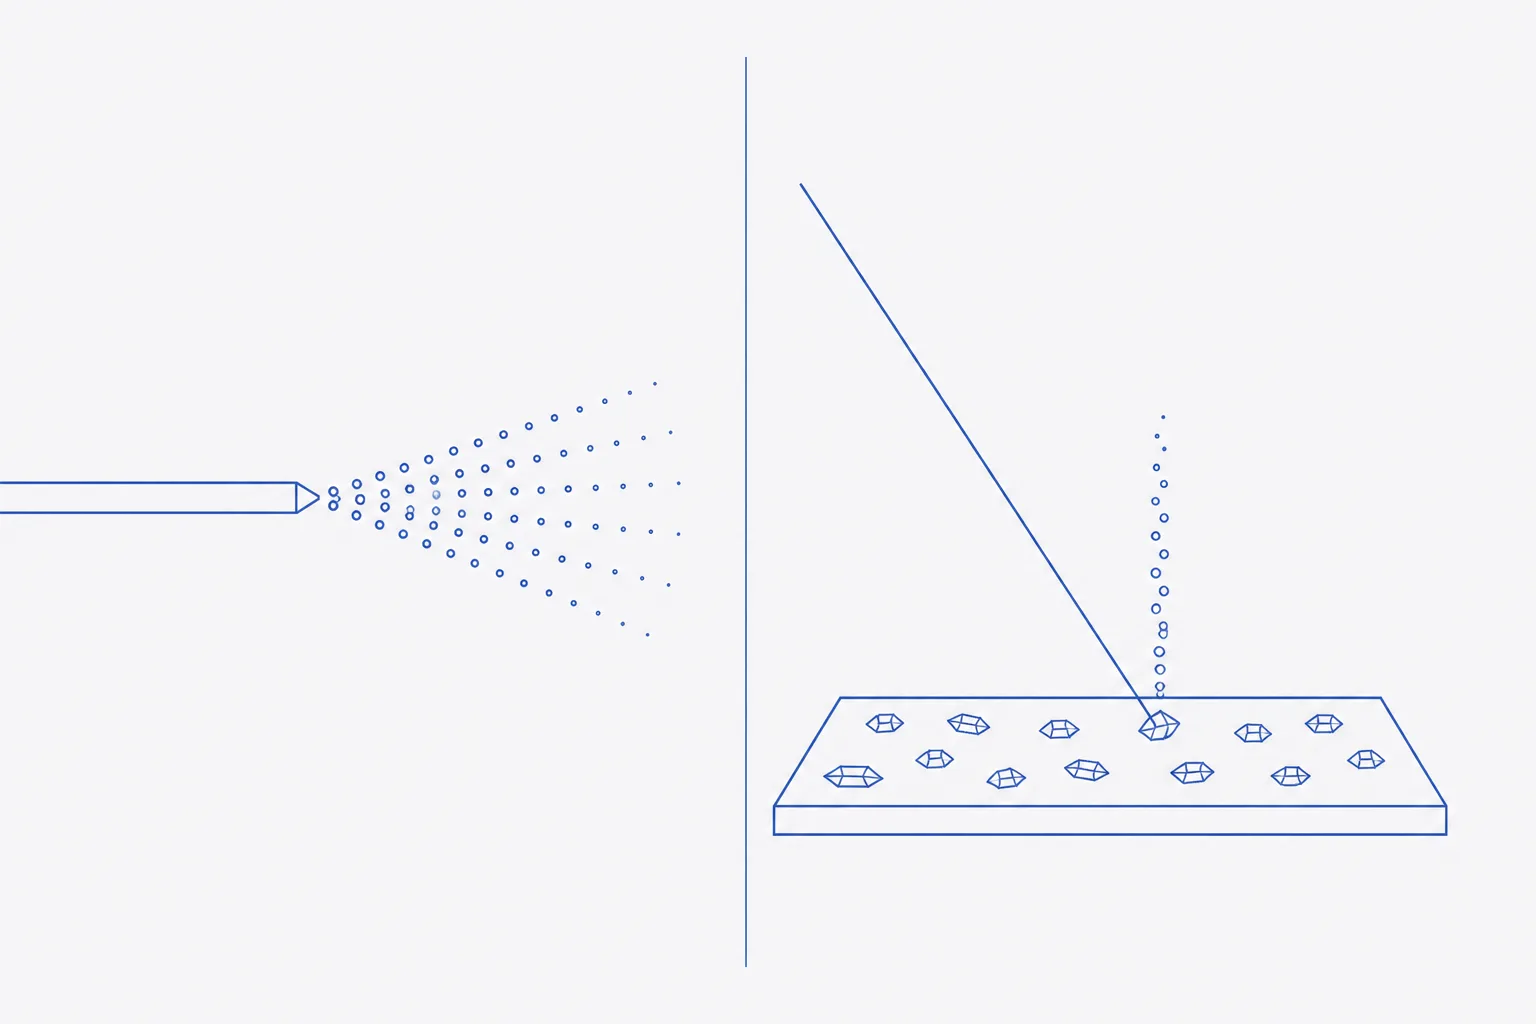
How each ionisation route works
Electrospray sprays the sample solution from a charged capillary into a fine mist of droplets. As solvent evaporates the droplets shrink and the charge density rises until gas-phase ions are released. Large polar molecules survive the process intact and appear as a coherent series of peaks, each carrying one more proton than its neighbour 1. Because it works on a flowing liquid, electrospray is the natural interface to a chromatograph: the column eluate enters the source continuously.
MALDI mixes the sample with a large molar excess of a small ultraviolet-absorbing organic acid, dries the mixture on a metal target, and fires a pulsed laser at the crystals. The matrix absorbs the energy, sublimes, and carries intact analyte molecules into the gas phase, where proton transfer gives mostly singly charged ions. The technique was reported for intact proteins in 1988, in two independent papers using different matrices 2 3. Ions formed in a pulse are accelerated into a flight tube; lighter ions arrive first, so flight time gives m/z.
| Property | ESI-LC-MS | MALDI-TOF |
|---|---|---|
| Sample state | Flowing solution; column eluate | Dried spot co-crystallised with matrix |
| Typical charge | Several charge states per species | Mostly singly charged [M+H]+ |
| Separation before measurement | Yes, online chromatography | None, unless fractions are spotted offline |
| Tolerance of salts and buffers | Low; salts suppress signal and form adducts | Moderate; desalting still improves spectra |
| Low-m/z interference | Solvent and modifier clusters | Matrix ions crowd the low-m/z region |
| Modifier effects | Trifluoroacetic acid suppresses signal | Acid content affects crystallisation |
| Throughput | One chromatographic run per sample | Many spots per target; seconds per spectrum |
| Fragmentation available | Routine on tandem instruments | Available on TOF/TOF instruments |
What each spectrum looks like for a 20-residue peptide
Take a generic 20-residue peptide with a monoisotopic neutral mass of 2,200.000 Da. Under electrospray it appears at approximately (M + 1.007n)/n for n protons: near m/z 1101.0 at 2+, 734.3 at 3+ and 551.0 at 4+. The spacing between isotope peaks within each cluster is 1/n — 0.5, 0.33 and 0.25 — which is how a high-resolution instrument assigns the charge directly. Under MALDI the same peptide appears essentially as one ion near m/z 2201.0, with a smaller 2+ signal at most.
The practical difference is in the rest of the spectrum. The LC-MS run is a chromatogram with a mass spectrum behind every point, so a deletion impurity eluting a minute before the main peak is measured separately and assigned its own mass. The MALDI spectrum is a single snapshot of everything on the spot. Species compete for charge during desorption, so a minor impurity may be suppressed below detection by the main component, and relative peak heights say little about relative amounts.
Resolution, mass accuracy and ppm
Two properties are often confused. Resolving power is the ability to separate two neighbouring m/z values, usually expressed as m/Δm with Δm taken as the peak width at half height. Mass accuracy is how close a measured m/z lies to the true value. A high-resolution analyser can still be inaccurate if it is poorly calibrated; a well-calibrated low-resolution analyser cannot report a meaningful sub-dalton figure because it cannot separate the isotope peaks.
Accuracy is expressed in parts per million: the difference between observed and theoretical mass, divided by the theoretical mass, multiplied by one million. For the example peptide an observed 2,200.011 Da against 2,200.000 Da is a deviation of 0.011 Da, or 5.0 ppm. An observed MALDI ion at m/z 2201.030 against a theoretical 2201.007 is 0.023 Da, or about 10 ppm. The same absolute error means fewer ppm on a larger molecule, which is why ppm is used to compare across sizes.
The term mass accuracy is used loosely. A review of its use distinguished a single reported deviation, the statistical accuracy of an instrument across many measurements, and the tolerance window set for accepting a match, and recommended that only the statistical sense be called mass accuracy 4. For identity work that has a direct consequence: one measurement that happened to land within 2 ppm does not show that the instrument is a 2 ppm instrument, and the acceptance tolerance should be set from the instrument's demonstrated performance, not from its brochure.
| Analyser | Isotope peaks resolved for a 2 kDa peptide | Supports a ppm claim | Typical coupling |
|---|---|---|---|
| Single or triple quadrupole, unit resolution | No | No; report to the nearest dalton or tenth | ESI-LC-MS |
| Ion trap | Partly, in enhanced-resolution scans | Rarely | ESI-LC-MS |
| TOF, linear mode | No | No; used for larger molecules and sensitivity | MALDI |
| TOF, reflectron mode | Yes | Yes, with close external or internal calibration | MALDI |
| Quadrupole-TOF | Yes | Yes, low ppm with lock-mass correction | ESI-LC-MS |
| Orbitrap or FT-ICR | Yes, comfortably | Yes, low or sub-ppm | ESI-LC-MS |
Calibration
Every ppm figure is only as good as the calibration behind it. External calibration uses a standard mixture measured before or between samples; drift between calibration and measurement adds directly to the error. Internal calibration places a known reference ion in the same spectrum — a lock mass infused alongside the eluate in ESI, or a calibrant peptide mixed into the spot in MALDI — and corrects each spectrum individually. For MALDI, calibrant spots adjacent to the sample spot give much better results than a calibration made at the other end of the target, because flight time depends on the exact position and height of the crystal surface.
- Choose calibrants that bracket the expected m/z of the peptide, not only one side of it.
- Record the calibration date, time and the residual error of the calibrant fit.
- Measure a known check standard within the same session and record its deviation.
- State whether the reported mass was internally or externally calibrated.
- Set the acceptance tolerance from the check-standard history, not from the specification sheet.
Sample preparation differences
ESI-LC-MS inherits its constraints from the chromatography. Non-volatile buffers and phosphate are excluded from the mobile phase. Trifluoroacetic acid, the modifier that gives the sharpest ultraviolet peaks, suppresses electrospray signal through ion pairing and surface-tension effects 5, so LC-MS methods usually switch to formic acid and accept broader peaks. Where an ultraviolet purity method must be kept unchanged, the eluate can be split, or a post-column additive used, but the simplest route is a separate MS-compatible method.
MALDI depends on crystallisation. α-Cyano-4-hydroxycinnamic acid is the usual matrix for peptides; sinapinic acid is preferred for proteins; 2,5-dihydroxybenzoic acid forms larger, less uniform crystals but tolerates contaminants better. Crystals form unevenly, so signal varies from point to point and the operator samples several positions. Desalting with a small reversed-phase tip before spotting improves signal markedly for salt-rich samples.
Choosing between them
| Question | Better choice | Reason |
|---|---|---|
| Does the main component have the expected mass? | Either | Both give a mass; MALDI is faster for a single species |
| What are the masses of the impurity peaks? | ESI-LC-MS | Separation first; each peak gets its own spectrum |
| Is a co-eluting species hiding under the main peak? | ESI-LC-MS | Extracted-ion chromatograms show masses that the ultraviolet trace merges |
| Many samples, quick mass screen | MALDI-TOF | Dozens of spots per target, seconds per spectrum |
| Salt-rich or crude sample | MALDI-TOF | More tolerant, though desalting still helps |
| Sequence order | Tandem MS on either | Neither intact-mass measurement addresses order |
| How much target is present | Neither alone | Ionisation efficiency differs between species; quantify by chromatography against a standard |
Regulatory practice for synthetic peptides treats mass as one element of identity rather than the whole of it. The European guideline recommends at least two orthogonal methods for identification and lists mass, relative retention time, LC-MS, peptide mapping, amino acid analysis and NMR among the acceptable ones, adding that the chosen combination must confirm the sequence unambiguously 6. An ESI-LC-MS run supplies two of those at once — retention time against a reference and mass — which is one reason it has become the default identity measurement.
What an identity report should state
- Ionisation mode and polarity: electrospray or MALDI, positive or negative.
- Analyser type and, for MALDI, linear or reflectron mode.
- For LC-MS: column, mobile phases, modifier and gradient, and the retention time of the main peak.
- For MALDI: the matrix and whether the sample was desalted.
- Observed m/z values with their charge states, not only a final neutral mass.
- Whether the reported mass is monoisotopic or average.
- Calibration: internal or external, calibrant, and date.
- Deviation in daltons and in ppm, and the acceptance tolerance applied.
- The spectrum itself, and for LC-MS the total-ion and ultraviolet chromatograms.
A report carrying all nine items lets a reader decide what the measurement proves. A report giving only a neutral mass and the word confirmed does not; it names a result without the conditions needed to judge it.
References
- Electrospray ionization for mass spectrometry of large biomolecules
- Laser desorption ionization of proteins with molecular masses exceeding 10,000 daltons
- Protein and polymer analyses up to m/z 100 000 by laser ionization time-of-flight mass spectrometry
- On the proper use of mass accuracy in proteomics
- Enhanced sensitivity for peptide mapping with electrospray liquid chromatography-mass spectrometry in the presence of signal suppression due to trifluoroacetic acid-containing mobile phases
- Guideline on the Development and Manufacture of Synthetic Peptides (EMA/CHMP/CVMP/QWP/367182/2025)