CD Spectroscopy of Peptides: Set-Up and Molar Ellipticity
Acquiring a far-UV circular dichroism spectrum of a peptide and converting millidegrees to mean residue ellipticity: buffers that do not absorb, pathlength and concentration pairing, the high-tension limit, baseline subtraction, a worked conversion, reference spectra, and why short peptides read as disordered.
A far-UV circular dichroism (CD) spectrum of a peptide is acquired from about 260 nm down to 190 nm in a short-pathlength quartz cell, in a buffer that does not absorb in that range, and is converted from observed millidegrees to mean residue ellipticity with [θ] = θ × MRW ÷ (10 × l × c), where MRW is the mean residue weight, l the pathlength in centimetres and c the concentration in mg·mL⁻¹ 12. The spectrum reports the average backbone conformation of the ensemble of molecules in the sample. For a short peptide in water it usually reports a flexible, largely disordered ensemble, and that is a property of the peptide's size and not a failure of the instrument.
The companion references cover buffer selection and concentration measurement from ultraviolet absorbance. This page covers the bench steps: the choice of buffer and cell, the acquisition parameters, baseline subtraction, the conversion with a worked example, the shapes of reference spectra, and what a short peptide spectrum can and cannot show. Worked figures use an invented 15-residue peptide with a mass of 1,750 g·mol⁻¹; they describe no real measurement.
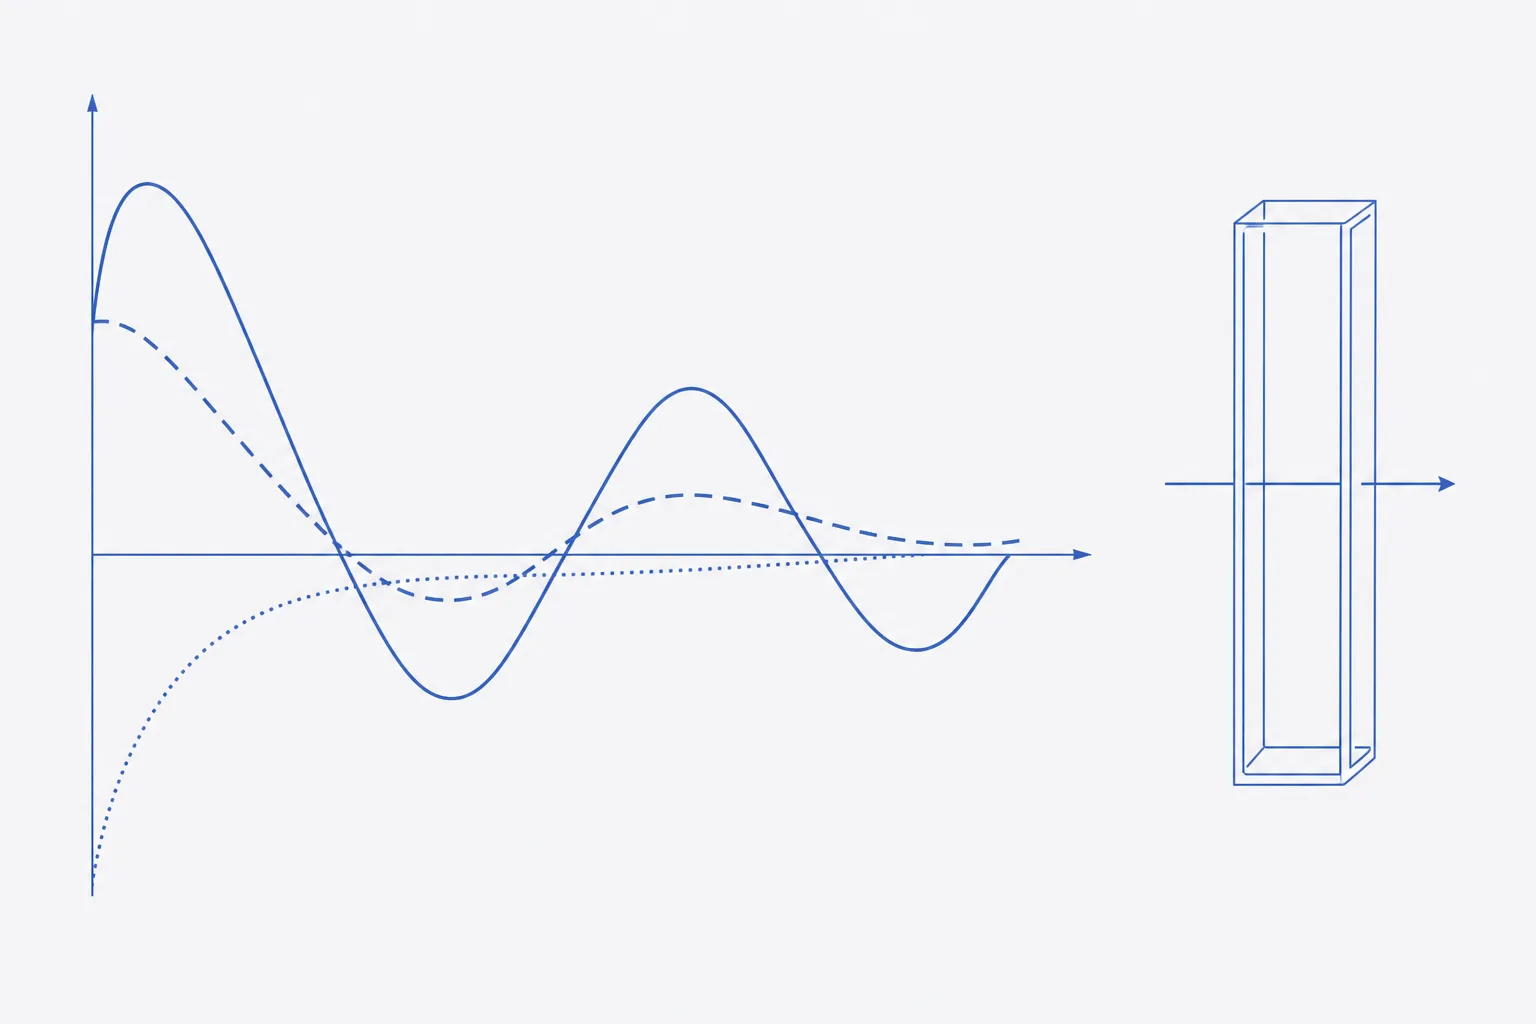
What far-UV CD reports and what it does not
Between roughly 190 and 250 nm the chromophore is the peptide bond. A bond in a regular, repeating environment, such as a helix, absorbs left and right circularly polarised light differently, and the instrument reports the difference as ellipticity. The signal depends on the backbone geometry and, to a smaller degree, on aromatic side chains and disulfides 12. Near-UV CD, 250 to 320 nm, reports tertiary environment of aromatic residues and is of little use for short peptides without a fixed fold.
Three limits apply to any spectrum. It is an average over all molecules and all conformers in the sample, so a 50:50 mixture of folded and unfolded chains looks identical to a population of chains that are each half-folded. It gives no residue-level position. And it is sensitive to the presence of aggregates and light scattering, which distort the spectrum without any change in the monomer. The companion reference on aggregation covers detection of these before the measurement.
Buffers and solvents: what absorbs below 200 nm
Everything in the cell absorbs light at some wavelength, and in the far-UV region many common laboratory components do. When the sample absorbs too much, too little light reaches the detector, the HT voltage rises, noise grows and the data below a certain wavelength are meaningless. The choice of buffer therefore sets how far down the spectrum can be recorded 12.
| Component | Suitability | Note |
|---|---|---|
| Sodium or potassium phosphate, 5 to 20 mmol·L⁻¹ | Suitable | First choice; keep concentration low |
| Fluoride and sulfate salts | Suitable | Substitute for chloride when ionic strength is needed |
| Sodium chloride, above about 10 mmol·L⁻¹ | Poor | Chloride absorbs strongly below 200 nm; limits the range recorded |
| Tris, HEPES, imidazole, other organic buffers | Poor | Absorb below 220 nm |
| Dimethyl sulfoxide and other organic cosolvents | Avoid | Absorb strongly; remove or dilute to a negligible level |
| Dithiothreitol and other reducing agents | Avoid | Absorb below 250 nm; use tris(2-carboxyethyl)phosphine at low level only if needed |
| Trifluoroacetate counter-ion | Check | Absorbs in the far-UV and is in the sample but not in the buffer blank; exchange the counter-ion or limit the range |
| Trifluoroethanol | Use with care | Used deliberately to induce helix; a matched blank is essential |
The trifluoroacetate row is the one specific to synthetic peptides. A peptide supplied as a trifluoroacetate salt carries the counter-ion into the cell at a concentration that scales with the peptide, and no buffer blank contains it. Subtraction cannot correct for it, so the far-UV end of the spectrum can be dominated by counter-ion absorbance. Exchange it for chloride or acetate before measurement, or accept a shorter range, and record the counter-ion in the sample description.
Concentration, pathlength and the HT limit
The aim is a signal large enough to measure without so much absorbance that the detector runs out of light. A shorter path allows a more concentrated sample and a lower buffer contribution. A facility page lists quartz cells from 0.01 to 1 cm, peptide concentrations of 0.05 to 2 mg·mL⁻¹ depending on the pathlength, and fill volumes of about 26 µL for a 0.1 mm cell and 700 µL for a 1 mm cell 5. The HT voltage is displayed alongside the spectrum. Instruments state a voltage above which the data are unreliable; read it from the manual and mark on the record the wavelength at which the sample reaches it.
- Estimate the concentration from the net peptide content, from amino acid analysis, or from absorbance at 280 nm where the peptide contains tyrosine or tryptophan. Do not use gross weight.
- Choose a pathlength: 0.1 cm for about 0.1 to 0.2 mg·mL⁻¹, or 0.01 cm for 1 to 2 mg·mL⁻¹. Prefer the shorter cell when the peptide dissolves well.
- Fill the cell without bubbles. Rinse with the sample and discard the first fill.
- Run a quick scan and watch HT. If it exceeds the limit above a given wavelength, shorten the pathlength or reduce the absorbing component, and do not interpret the spectrum below that wavelength.
- Re-measure the concentration after the scan, by absorbance of the same solution, to detect loss by adsorption or precipitation.
Acquisition parameters and baseline subtraction
| Parameter | Typical value | Reason |
|---|---|---|
| Wavelength range | 260 nm to 190 nm, scanning downwards | Includes a flat region for the zero offset; stop where HT reaches the limit |
| Bandwidth | 1 nm | Adequate for broad peptide bands |
| Data pitch | 0.5 to 1 nm | Enough points to define the minima |
| Scan speed and response time | 50 nm·min⁻¹, 1 to 2 s | Trade-off between noise and time |
| Accumulations | 3 to 5, averaged | Improves signal to noise |
| Temperature | 20 °C, controlled; the facility page lists 4 to 90 °C for melting studies | Conformation of peptides depends on temperature |
| Pathlength | 0.1 cm, or 0.01 cm for concentrated samples | See concentration pairing above |
| Purge | Nitrogen, flowing before and during the scan | Oxygen absorbs below about 200 nm and damages optics |
Baseline subtraction removes the contribution of the buffer and the cell. Scan the buffer alone, in the same cell, in the same position, under identical parameters, ideally before and after the sample. Subtract the buffer spectrum from the sample spectrum. Then examine the region between 250 and 260 nm, where the peptide has no signal: it should be flat and near zero, and any remaining offset is subtracted from the whole spectrum. A baseline that is not near zero there signals scattering, a dirty cell or a mismatched blank 1.
From millidegrees to mean residue ellipticity
The instrument records ellipticity θ in millidegrees. To compare spectra of different peptides, lengths and concentrations, convert to mean residue ellipticity, [θ], in deg·cm²·dmol⁻¹, by normalising to the number of peptide bonds, the pathlength and the concentration. The mean residue weight for a peptide of M g·mol⁻¹ with N residues is M ÷ (N − 1), the mass per peptide bond; for a protein the convention is M ÷ N. State which was used, since the choice shifts a short peptide's value by several per cent 12.
- Peptide: invented, N = 15 residues, M = 1,750.0 g·mol⁻¹. MRW = 1,750.0 ÷ 14 = 125.0 g·mol⁻¹ per peptide bond.
- Concentration: 0.20 mg·mL⁻¹ of net peptide, from amino acid analysis. Pathlength l = 0.1 cm.
- Observed after buffer subtraction and offset correction: θ = −9.6 mdeg at 222 nm and θ = −31.5 mdeg at 198 nm.
- [θ] = θ × MRW ÷ (10 × l × c). Denominator: 10 × 0.1 × 0.20 = 0.20.
- At 222 nm: [θ] = −9.6 × 125.0 ÷ 0.20 = −6,000 deg·cm²·dmol⁻¹.
- At 198 nm: [θ] = −31.5 × 125.0 ÷ 0.20 = −19,700 deg·cm²·dmol⁻¹ (rounded from −19,688).
- To express as molar circular dichroism, Δε = [θ] ÷ 3,298 (per residue): −6,000 gives −1.8 and −19,700 gives −6.0 M⁻¹·cm⁻¹.
Sensitivity of the result to the inputs is the reason to record them. If the true concentration were 0.16 mg·mL⁻¹ rather than 0.20, the same observed signal at 222 nm would give −7,500, a 25% larger magnitude. Using M ÷ N with N = 15 instead of N − 1 gives MRW = 116.7 and −5,600. A strong band near 198 nm with little at 222 nm is the signature of the next section.
Reference spectra
| Structure | Negative bands | Positive band | Comment |
|---|---|---|---|
| α-Helix | Near 222 nm and 208 nm | Near 192 nm | Magnitude at 222 nm grows with helix length |
| β-Sheet | Near 216 to 218 nm | Near 195 nm | Weaker than helix; varies with twist and aggregation |
| Disordered (random coil) | Strong, below 200 nm, near 195 to 198 nm | Little above 210 nm | Small and often slightly positive signal near 220 nm |
| Polyproline II | Weak, near 205 nm | Weak, near 218 nm | Easily mistaken for disorder in short peptides |
The invented peptide's strong negative at 198 nm and weak signal at 222 nm place it with the disordered reference. Online servers such as DICHROWEB fit a spectrum to a basis set of protein spectra to give helix, sheet and coil fractions 4. The basis sets come from folded proteins. For a peptide of 15 residues the fits are unreliable, and the numbers they give should not be reported as secondary structure content without that caveat.
Why short peptides look disordered, and what to do about it
Helices are stabilised by cooperative hydrogen bonds between residues several positions apart. A short chain has too few turns to pay the cost of fixing its ends, so in water an isolated helix-forming peptide populates a mixture of helical segments, polyproline II and coil, and the average looks disordered. Helical content rises with length, with side-chain interactions, and in many sequences with lower temperature 13. Constraint by cyclisation, stapling or a disulfide also raises it; those are structural changes to the molecule and not to the measurement.
Useful comparisons for a peptide use one variable at a time. Scan across a temperature series in 5 to 10 °C steps and plot [θ] at 222 nm against temperature; a sigmoidal change suggests a cooperative transition, a gradual one a population shift. Titrate cosolvent in steps. Compare a batch with a reference batch of the same sequence under identical conditions, which can show a difference in conformational ensemble even when mass and purity agree.
Recording concentration provenance with the spectrum
A spectrum without its concentration is a shape only. The normalised value is only as good as the number in the denominator, and the three common sources differ in reliability: weighed gross mass overstates peptide by the water, counter-ion and salt present; absorbance at 280 nm is accurate only if the extinction coefficient is correct and the sequence contains Tyr or Trp; amino acid analysis is the most direct but destroys the sample. Record the source, the method and its result beside each spectrum, and whether the concentration was measured before or after the scan.
- Sample: batch reference, counter-ion, buffer composition and pH, and how the solution was made.
- Concentration: value, method (net peptide content, amino acid analysis, absorbance at 280 nm), and whether before or after the scan.
- Cell: pathlength, material, cleaning, and the buffer baseline filename.
- Instrument: model, purge, bandwidth, data pitch, scan speed, accumulations, temperature and the HT limit applied.
- Processing: baseline subtraction, offset correction, smoothing if any, MRW convention and the formula applied.
- Result: [θ] at defined wavelengths, the lowest reliable wavelength, and a statement of what the spectrum does and does not show about the structure.
References
- Using circular dichroism spectra to estimate protein secondary structure
- How to study proteins by circular dichroism
- Mechanism of helix induction by trifluoroethanol: a framework for extrapolating the helix-forming properties of peptides from trifluoroethanol/water mixtures back to water
- DICHROWEB, an online server for protein secondary structure analyses from circular dichroism spectroscopic data
- BiophysX - Circular Dichroism (Jasco J-720 facility page)