quantification
UV Absorbance at 280 nm: Concentration Without a Balance
An optical measurement of peptide concentration that is blind to counterion, water and salt — and that returns nothing at all for a sequence carrying no aromatic residues. Coefficients, path length, interference and the failure cases.
Absorbance at 280 nm returns a peptide concentration from an optical measurement rather than a mass measurement. It counts aromatic side chains, so it is blind to counterion, residual water and residual salt — the three terms that separate gross weight from peptide mass. That is its advantage, and it is a considerable one. Its limitation is equally sharp. The signal is carried almost entirely by tryptophan, at a molar absorption coefficient near 5,500 L·mol⁻¹·cm⁻¹, against roughly 1,490 for tyrosine and 125 for cystine 2. A sequence containing none of the three has nothing to read, and the method returns no figure rather than a poor one.
Beer–Lambert and what it assumes
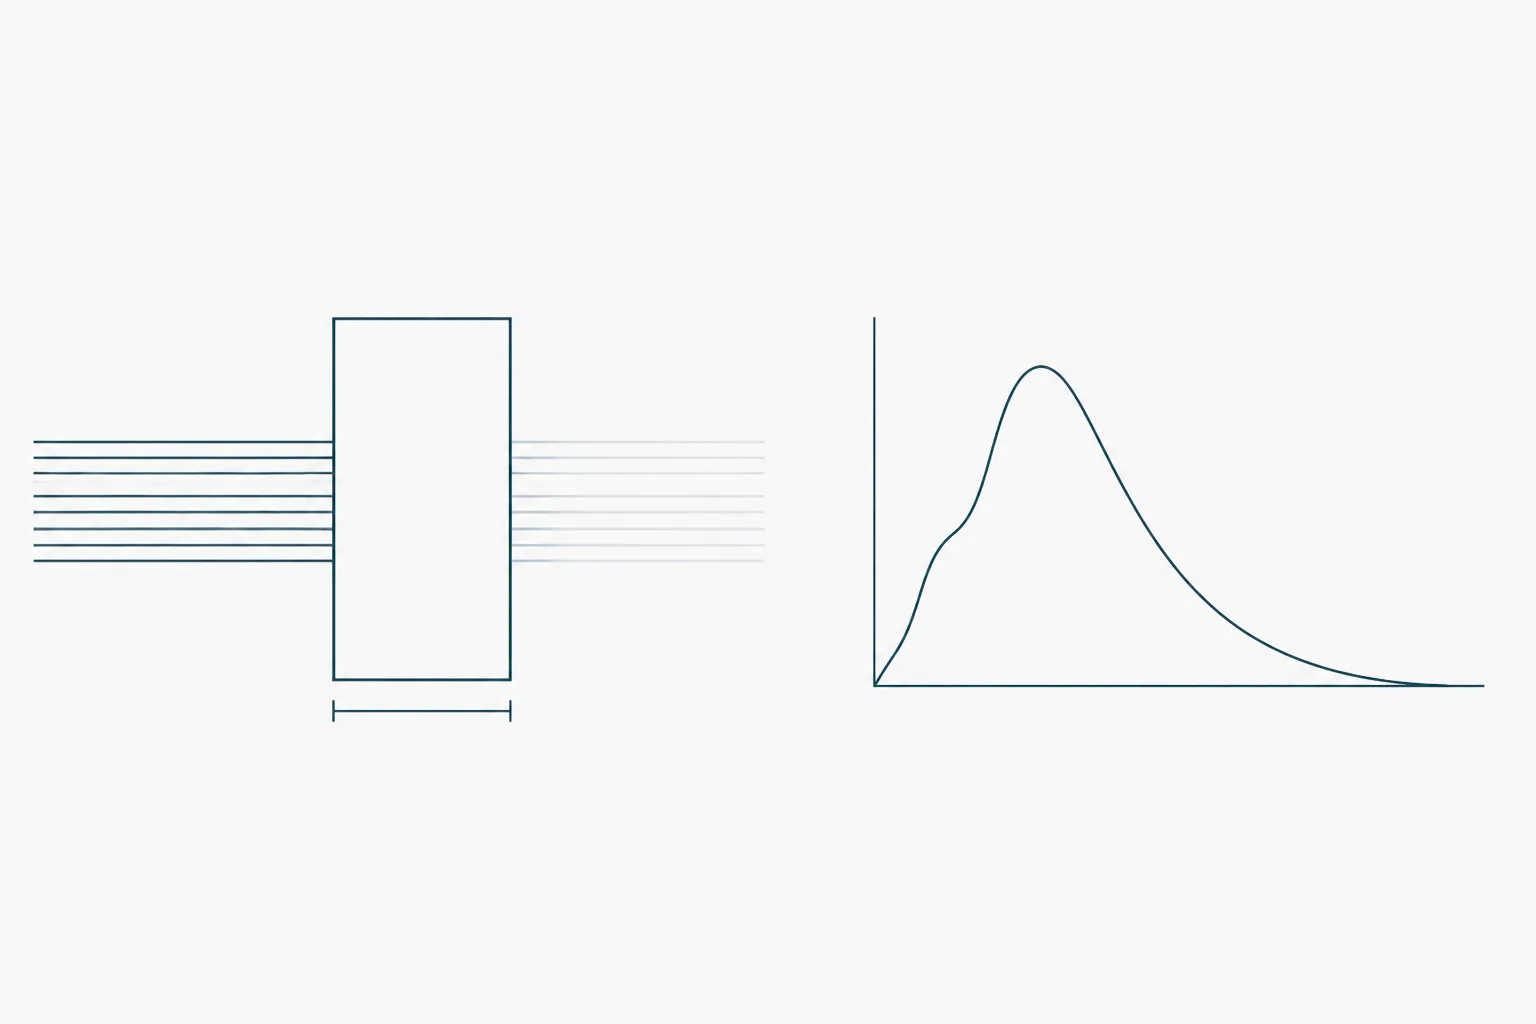
The relation is A = ε c l. Absorbance A is dimensionless, the base-ten logarithm of the ratio of incident to transmitted intensity. The molar absorption coefficient ε carries units of L·mol⁻¹·cm⁻¹, concentration c is in mol·L⁻¹ and path length l in cm. Rearranged for the quantity wanted: c = A ÷ (ε × l). Two of the three inputs are supplied rather than measured — the coefficient from sequence, the path from the cell — so the accuracy of the result is set as much by bookkeeping as by the instrument.
The law is a limiting case, and every term of it assumes conditions that a real sample can violate.
- Monochromatic incident light. Real monochromators pass a finite spectral bandwidth, which flattens sharp absorbance features.
- Independent absorbing species. Association, aggregation and stacking at higher concentration change the effective coefficient.
- No scattering. Light removed from the beam by redirection is counted as absorbed.
- No fluorescence or stray light reaching the detector. Stray light is the dominant cause of negative deviation at high absorbance.
- A homogeneous sample of uniform thickness across the illuminated area.
- A detector response that is linear over the range in use.
The consequence is a working range rather than a universal linearity. Below about 0.1 absorbance units the reading is dominated by baseline noise and cell-to-cell mismatch. Above roughly 1.5 the stray-light contribution bends the response downward, so a high reading understates concentration. Dilute quantitatively into the middle of the range rather than accepting an out-of-range value, and record the dilution factor as it was actually measured, not as it was intended 5.
Which residues absorb, and what happens when none do
Near-ultraviolet absorbance in a peptide comes from three sources only. Everything else in the chain is transparent at 280 nm.
| Source | Absorbance maximum | Coefficient at 280 nm | Note |
|---|---|---|---|
| Tryptophan | Near 280 nm | About 5,500 | Dominates the signal wherever it is present |
| Tyrosine | Near 275 nm | About 1,490 | Roughly one quarter the tryptophan contribution |
| Cystine (disulfide) | Near 250 nm | About 125 | Only the oxidised, bonded form contributes |
| Cysteine (free thiol) | — | Negligible | Counted as zero; reduction removes the cystine term |
| Phenylalanine | Near 257 nm | Negligible | Does not contribute at 280 nm despite being aromatic |
| Peptide bond | 190–220 nm | None | The basis of far-ultraviolet measurement instead |
Two coefficient sets are in general circulation. The values above follow the determinations of Pace and colleagues in aqueous buffer 2; the earlier set derived by Gill and von Hippel gives 5,690 for tryptophan and 1,280 for tyrosine 1. Both are defensible. Mixing them is not. The difference is a few per cent on a tryptophan-containing sequence and proportionally larger on one carrying tyrosine alone, which is enough to make two nominally identical stock solutions disagree for no physical reason. Choose one set, state which, and keep it constant across a project.
The awkward case is the sequence containing no tryptophan, no tyrosine and no disulfide. Short synthetic sequences fall into it routinely. There is no partial signal to work with and no correction that recovers one — absorbance at 280 nm is simply flat. Three routes remain. Far-ultraviolet measurement uses the peptide bond itself, and a coefficient at 205 nm can be predicted from sequence with useful accuracy for exactly these aromatic-free cases 4. Quantitative amino acid analysis measures composition after hydrolysis and does not depend on any chromophore. Nitrogen determination converts total nitrogen by a sequence-derived factor. Of the three, the far-ultraviolet route is the cheapest and the most sensitive to buffer choice, because most common additives are opaque below 220 nm.
Calculating an extinction coefficient from sequence
In ordinary practice the coefficient is computed rather than determined. The calculation is additive and takes a minute.
- Count tryptophan residues, tyrosine residues and disulfide bonds in the sequence. Count bonds, not cysteine residues — two cysteines form one cystine.
- Apply the sum: coefficient at 280 nm = (tryptophan count × 5,500) + (tyrosine count × 1,490) + (cystine count × 125).
- State explicitly whether the disulfide term was included. Material handled under reducing conditions carries no cystine contribution.
- Measure absorbance at 280 nm against a blank of the identical solvent.
- Compute molar concentration as absorbance divided by the product of coefficient and path length in cm.
- Convert to mass concentration by multiplying by the free-base molecular weight, not the salt molecular weight.
- Record the coefficient, the set it came from, the path length and the buffer in the same entry as the result.
A generic worked case makes the arithmetic concrete. A sequence carrying one tryptophan, two tyrosines and no disulfide has a coefficient of 5,500 + (2 × 1,490) = 8,480 L·mol⁻¹·cm⁻¹. An absorbance of 0.400 read across a 1.00 cm path gives 0.400 ÷ 8,480 = 4.72 × 10⁻⁵ mol·L⁻¹, or 47.2 µmol·L⁻¹. No balance was used, no assumption about moisture or counterion was required, and the figure is a peptide concentration rather than a solid concentration.
Accuracy of the calculated coefficient is good but bounded. Comparison against experimentally determined values puts the agreement within roughly five per cent for sequences containing tryptophan, and worse for sequences carrying tyrosine alone, where the local environment shifts a proportionally larger share of the total 2. Short unstructured peptides tend to agree better than folded proteins, because the chromophores are fully solvent-exposed and no burial term intrudes. The classical route to a measured coefficient is to record absorbance in a denaturant such as 6 mol·L⁻¹ guanidinium chloride, where every chromophore is exposed and the environment term is removed 3.
Path length, cuvettes and microvolume instruments
Path length enters the calculation linearly, so a ten per cent error in path is a ten per cent error in concentration. It is the input most often taken on trust. Cell material is the first constraint: optical glass and most plastics are opaque below about 300 to 340 nm, so ultraviolet work requires quartz or fused silica. A disposable cell rated for the visible range will read a plausible but meaningless number at 280 nm.
| Format | Nominal path | Typical volume | Principal error source |
|---|---|---|---|
| Standard quartz cuvette | 10 mm | 1–3 mL | Mismatch between sample and reference cells |
| Semi-micro quartz | 10 mm | 300–700 µL | Beam clipping if the cell is unmasked or badly seated |
| Ultra-micro quartz | 10 mm | 50–100 µL | As above, more severe; a beam mask is mandatory |
| Short-path cell | 1–2 mm | 100–300 µL | The scaling factor multiplies every error with the signal |
| Microvolume pedestal | 0.05–1 mm, computed | 1–2 µL | Path derived from a liquid column; surface tension and placement change it |
| Microplate well | Meniscus-dependent | 100–300 µL | Path is not fixed and must be corrected per well |
The microvolume pedestal instrument deserves particular care. It forms a short liquid column between two optical surfaces and infers the path from the gap, then scales the result to a 10 mm equivalent for reporting. That scaling multiplies both signal and error by a factor that can approach two hundred. Wipe both optical surfaces between every reading, replicate on freshly pipetted drops rather than re-reading a single drop, and treat a lone measurement as provisional. Viscous or detergent-containing samples form columns of a different shape and are the common source of a reading that will not reproduce.
Blanking is the other half of the same problem. Blank against the exact solvent the sample is dissolved in, from the same bottle, in the same cell, in the same orientation. A blank prepared from a nominally identical buffer made on a different day is not the same blank, and at absorbances near 0.1 the difference is a substantial fraction of the reading.
Interference, scattering and when to use another method
Everything else in the cell absorbs something. The question is whether it absorbs at the wavelength in use, and whether the blank subtracts it correctly.
| Interferent | Effect at 280 nm | Diagnostic | Handling |
|---|---|---|---|
| Nucleic acid | Strong 260 nm band with a tail across 280 nm | 260 to 280 ratio above the sequence expectation | Remove it; ratio corrections are approximate |
| Detergents with aromatic head groups | Strong absorbance near 275–280 nm | A high reading on the neat buffer blank | Substitute a detergent without an aromatic ring |
| Oxidised dithiothreitol | Absorbs near 280 nm; the reduced form does not | Blank drifts upward over the session | Prepare reductant fresh and re-blank |
| Guanidinium chloride, urea | Transparent at 280 nm | — | Acceptable here, opaque below 230 nm |
| Trifluoroacetate | Transparent at 280 nm | — | Acceptable here, fatal to far-ultraviolet work |
| Particulates and aggregate | Apparent absorbance across the whole spectrum | Non-zero reading at 320–340 nm | Centrifuge or filter, then re-read |
| Bubbles or marks on the optical face | Erratic and non-reproducible | Replicates disagree beyond noise | Re-seat, clean and re-read |
Scattering is the failure mode most often mistaken for signal. Particles of a size comparable to the wavelength remove light from the beam by redirection rather than absorption, and the instrument cannot distinguish the two. The wavelength dependence is steep, so scattering lifts the entire baseline and lifts it more at shorter wavelengths, which inflates a 280 nm reading while leaving the spectrum superficially normal. The check is free. Read at 320 nm and 340 nm, where peptide does not absorb. Anything materially above zero there means the working figure is high. Empirical corrections that extrapolate the scattering curve back from the long-wavelength region exist and are approximate; clarifying the sample is a better answer than correcting the number 5.
Run the measurement as a fixed sequence rather than a single button press. Acquire the full spectrum from 240 to 350 nm rather than a single wavelength, and confirm the maximum sits near 278 nm — a shifted or featureless curve is evidence of interference, not of an unusual peptide. Take three readings on independently loaded cells and treat their spread as the uncertainty of the result.
Finally, the cases where the method should not be used at all. A sequence with no aromatic residues or disulfides gives no signal. A sample that cannot be clarified gives a scattering-inflated one. A buffer containing an aromatic additive gives a blank-limited one. And where the requirement is an absolute figure for peptide mass fraction rather than a working concentration — the number that reconciles a solid mass with the peptide in it — absorbance cannot supply it, because it measures only the molecules carrying a chromophore and says nothing about the rest of the solid. That question belongs to amino acid analysis, with moisture and counterion determination accounting for the remainder of the mass.
Absorbance is an observation; concentration is an inference from it, resting on a coefficient taken from a published table, a path length taken from a cell specification and a blank taken from a bottle. Record all three with the result and a disagreement six months later can be traced.
References
- Calculation of protein extinction coefficients from amino acid sequence data
- How to measure and predict the molar absorption coefficient of a protein
- Spectroscopic determination of tryptophan and tyrosine in proteins
- Sequence-specific determination of protein and peptide concentrations by absorbance at 205 nm
- Spectrophotometric determination of protein concentration