Capillary Electrophoresis as an Orthogonal Peptide Purity Check
Capillary zone electrophoresis separates peptides by charge-to-size ratio, not hydrophobicity. The separation principle, background electrolyte and pH choice, conditioning and start-up sequence, far-UV detection, reading an electropherogram against a chromatogram, and a reference parameter table for a first method.
Capillary zone electrophoresis (CZE) separates peptides by their charge-to-size ratio in free solution, while reversed-phase HPLC separates them by hydrophobicity. Because the two properties are largely independent, a species that hides under the main peak in one method often resolves in the other, which is why CZE is the usual second, orthogonal purity method 12. It is set up as a fused-silica capillary filled with a low-pH phosphate buffer, a hydrodynamic injection of a few nanolitres, a field of 20 to 30 kV and detection near 200 nm.
The companion reference on reversed-phase method parameters covers the hydrophobicity-based method. This page covers the second one: what the separation is based on, how the buffer is chosen against the peptide's isoelectric point, the conditioning and start-up sequence, detection, and how to read an electropherogram next to a chromatogram. Worked figures use an invented decapeptide, AGSKLEYFVR, and a lysine-deletion impurity of it; they describe no real method.
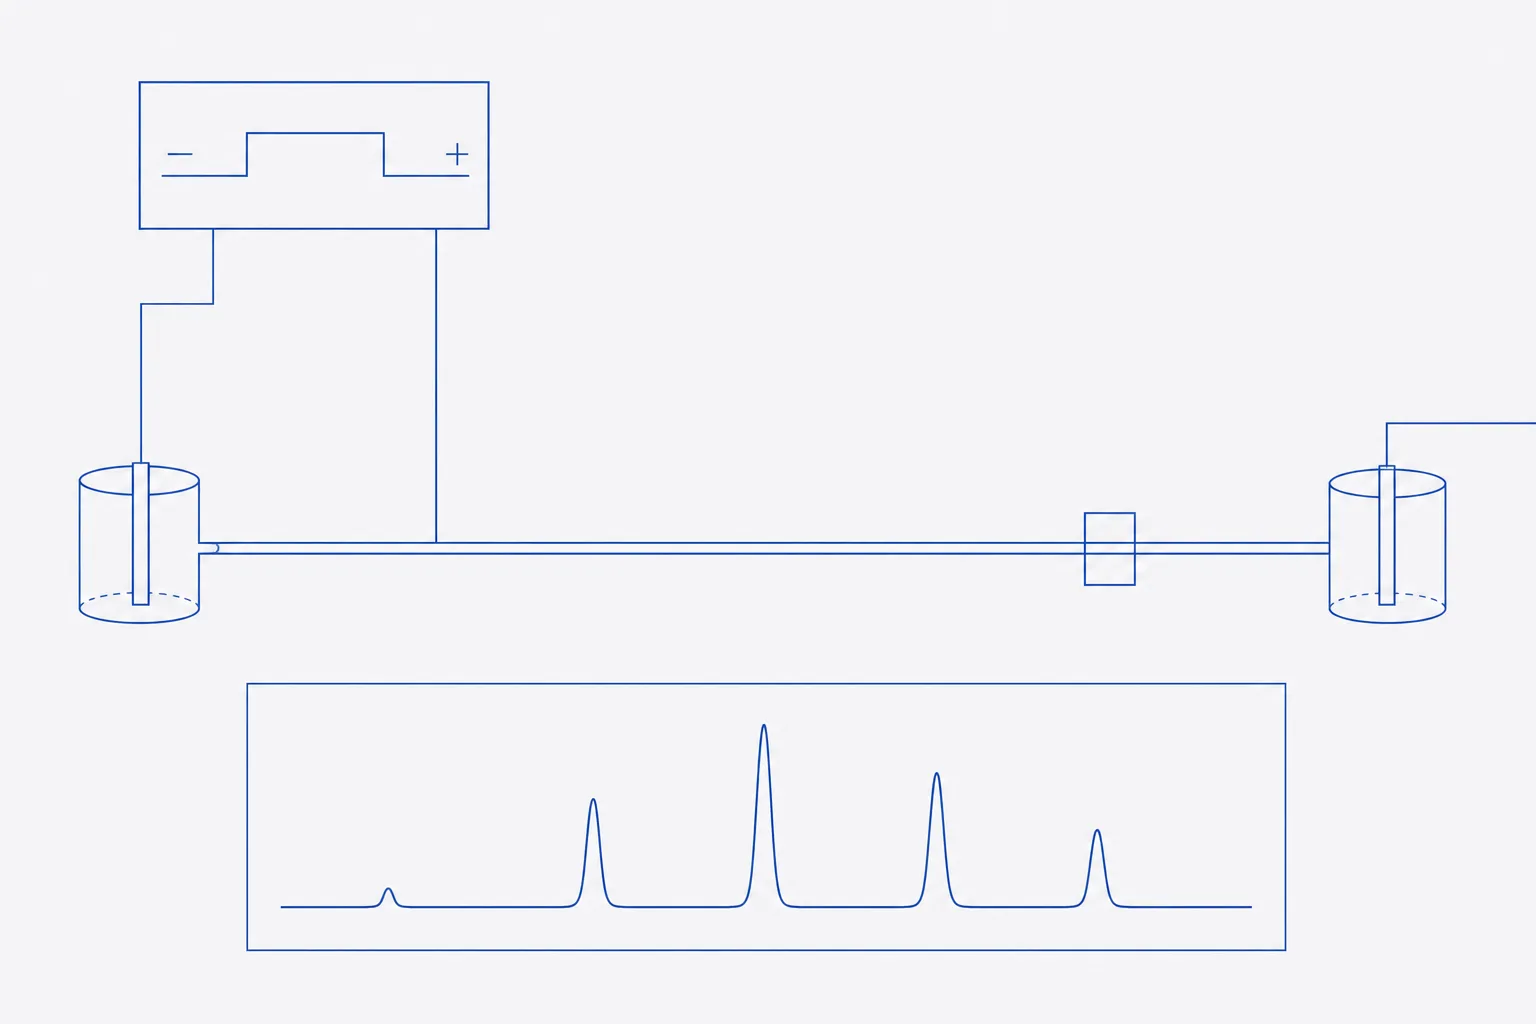
Separation principle: charge-to-size and electro-osmotic flow
In free-solution CE a field is applied along a buffer-filled capillary and each ion migrates at a velocity set by its electrophoretic mobility. For peptides the mobility rises with net charge and falls with size. Offord's early relation for peptides on paper, in which mobility is proportional to charge divided by molecular mass raised to the two-thirds power, remains the working model for ordering peptides in CZE 4. Grossman and co-workers showed that the same quantities govern separation in free-solution capillaries and that peptide mobilities in them are predictable from sequence 3.
The second term is electro-osmotic flow (EOF). Silanol groups on the inner wall of a fused-silica capillary ionise as pH rises, giving the wall a negative charge and driving bulk buffer towards the cathode. Observed migration is the sum of the peptide's own mobility and the EOF. At pH 2.5 the silanols are largely protonated, EOF is small and cationic peptides migrate towards the cathode at their own mobility; at pH 7 the EOF is large and sweeps almost everything past the detector in order of increasing anionic character 2. EOF is therefore the variable that most affects reproducibility, and every run needs a neutral marker or a defined rinse that fixes it.
| Species | Monoisotopic mass, Da | Estimated net charge at pH 2.5 | Relative mobility (arbitrary units) |
|---|---|---|---|
| AGSKLEYFVR (main peak) | 1,169.35 | +2.9 (N-terminus, Lys, Arg; carboxyls largely neutral) | 0.0262 |
| Lysine-deletion impurity | 1,041.26 | +1.9 (N-terminus, Arg) | 0.0186 |
| Ratio, impurity ÷ main | — | — | 0.71 |
A species that has lost a basic residue moves about 30% more slowly, which is a wide gap. The same impurity differs from the main peak by one amino acid in hydrophobicity and may elute within a few tenths of a minute of it in a gradient. This is the practical meaning of orthogonality: a deletion of a charged residue is a large change for CZE and a small one for RP-HPLC.
Why CZE is orthogonal to RP-HPLC
Two methods are orthogonal when the properties that drive retention in one are unrelated to those in the other. RP-HPLC partitions a peptide between a non-polar stationary phase and an organic-water mobile phase, and the main driver is hydrophobic surface. CZE has no stationary phase and no organic gradient; the driver is charge and hydrodynamic size 12. Impurity classes then split between the methods as the table shows.
| Impurity class | RP-HPLC resolution | CZE resolution | Reason |
|---|---|---|---|
| Deletion of a charged residue (Lys, Arg, Asp, Glu) | Often poor | Good | Large charge change, small hydrophobicity change |
| Deletion of a hydrophobic residue (Leu, Phe, Val) | Good | Moderate | Large hydrophobicity change, small charge change |
| Deamidation (Asn to Asp, Gln to Glu) | Variable, often partial | Good at moderate pH; weaker at pH 2.5 | One charge added when the carboxyl is ionised; negligible at low pH |
| Oxidation of Met | Good | Poor | Polarity change, no charge change |
| Truncated sequences lacking terminal charged residues | Moderate | Good | Charge and size both change |
| Residual counter-ions and small salts | Elute at the void; invisible | Migrate separately | Not retained by RP; mobile in CZE |
Background electrolyte and pH relative to the pI
The BGE sets the pH, the ionic strength and the wall charge, and so sets selectivity. The first decision is the pH relative to the peptide's isoelectric point (pI). A peptide carries zero net charge at its pI and migrates only with the EOF; the farther the pH from the pI, the larger its own mobility and, usually, the better the resolution of species with different charge. For a first method the conventional choice is a pH well below the pI of the main peak, where it is cationic, with a phosphate or similar buffer at 50 to 100 mmol·L⁻¹ 25.
Low pH has a second benefit. Basic peptides adsorb to ionised silanols, which broadens peaks and shifts migration times. At pH 2.5 few silanols are ionised, so adsorption falls. The cost is that carboxyl groups are also protonated, so charge differences from Asp, Glu or C-terminal changes are muted. If those are the species of interest, run a second BGE near pH 6 to 7 or, for a basic peptide with strong wall interaction, use a coated capillary.
- Calculate the net charge and pI of the target peptide and of the expected impurities. The companion calculation reference gives the method.
- Choose a BGE pH at least two units from the pI, usually below it for basic peptides.
- Prepare the BGE from analytical-grade salts in Type I water, adjust pH with the same acid or base as the buffer component, and filter through 0.2 µm.
- Degas if the instrument does not, and replace the BGE vials every few runs, since electrolysis changes their pH.
- If an organic modifier such as acetonitrile at 10 to 20% is needed to suppress hydrophobic wall interaction, add it to the BGE rather than the sample alone, and re-check mobility.
Conditioning, injection and voltage programme
A bare fused-silica surface changes with its history of exposure to base, acid and sample. Conditioning gives each run the same starting wall. The same rinse sequence is applied between every pair of injections so that the EOF is reset. The sequence below is a typical starting point for an uncoated capillary and should be tuned to the instrument and peptide.
- New capillary: flush with 1 mol·L⁻¹ sodium hydroxide for about 20 minutes, water for 10 minutes, and BGE for 20 minutes at high pressure.
- Thermostat the cartridge. Migration time varies with viscosity, which varies with temperature, so a stable value matters more than the chosen one; 25 °C is a common choice.
- Between runs: 0.1 mol·L⁻¹ sodium hydroxide for 2 minutes, water for 2 minutes, BGE for 3 minutes. Shorten only after showing that migration time is unchanged.
- Dissolve the sample in water or in dilute BGE at about 0.5 to 2 mg·mL⁻¹ gross. A sample ionic strength lower than that of the BGE sharpens the injected zone by stacking.
- Inject hydrodynamically, a low pressure for a few seconds, so that the plug is a small fraction of the capillary volume. Record pressure and time.
- Apply the voltage with a short ramp, 20 to 30 kV in a typical 50 µm bore capillary. Check that the current is stable; a rising current signals buffer depletion or Joule heating.
- Include a neutral EOF marker, such as dimethyl sulfoxide at a low concentration, in at least the system suitability injection, and run a reference standard before and after the sequence.
Detection: far-UV, and when CE-MS is warranted
Peptides absorb strongly at 190 to 220 nm through the peptide bond, so detection near 200 nm sees every species regardless of its side chains. The path length for an on-capillary window is the inner diameter, 50 µm in a standard capillary, an order of magnitude below the 1 cm cell of a UV detector in HPLC, so concentration limits of detection are higher and the sample must be more concentrated 1. Phosphate and borate are transparent at 200 nm; many organic buffers are not, and a high-absorbance BGE raises baseline noise.
Coupling to mass spectrometry (CE-MS) is warranted when a peak in the electropherogram needs an identity, for instance an unknown impurity that RP-HPLC did not show. It requires a volatile BGE such as dilute acetic or formic acid, which excludes phosphate, and a sheath-flow or sheathless interface. Where the purity question is answered by UV, CE-MS is an identification tool and not part of routine release 1.
Reading an electropherogram against the chromatogram
A chromatogram has peak area proportional to the amount of species that passes the detector. In CZE the same is not true: slower species spend longer in the detection window and so give a larger area for the same amount. Divide each area by its migration time before calculating percentages. Without this correction, late-migrating impurities are over-stated and the purity figure is biased low.
| Peak | Migration time, min | Raw area | Corrected area (area ÷ time) | Corrected % |
|---|---|---|---|---|
| Main peptide | 6.20 | 9,800 | 1,580.6 | 98.0 |
| Lysine-deletion impurity | 8.70 | 175 | 20.1 | 1.2 |
| Unknown, late | 10.40 | 132 | 12.7 | 0.8 |
The raw percentages here would be 97.0, 1.7 and 1.3; correction moves the main peak to 98.0. State the convention used on the report, since a purity value is meaningless without it. ICH Q2 accepts comparison with a second, well-characterised procedure as support for specificity 6, so set the result beside the area-percent from RP-HPLC. The two will rarely agree to the decimal, because they see different impurities. A sound check is that the main-peak value does not differ by more than the combined variability of the two methods, and that every impurity above the reporting threshold in either method is accounted for in the other, or explained.
Limitations
Migration time is the weak point of the technique. It depends on the capillary wall, the temperature, the BGE age and the injection history, so run-to-run variation of a few per cent is common unless the rinse is fixed. Correct by relative migration time against an internal marker, or by effective mobility calculated from the capillary length and the EOF marker. Other limits: low concentration sensitivity from the short path length; adsorption of strongly basic peptides to silica; a very small injection volume that makes sample preparation and dilution error dominant; and a narrow range for linearity compared with HPLC.
A reference parameter table for a first method
The values below are conventional starting points for a basic peptide of 1 to 5 kDa on an uncoated capillary. They are not validated settings, and each should be adjusted from the first runs and then fixed in the method 25.
| Parameter | Starting value | Reason and adjustment |
|---|---|---|
| Capillary | Uncoated fused silica, 50 µm inner diameter, 50 to 60 cm total, 40 to 50 cm to the detector | Longer effective length raises resolution and run time |
| Background electrolyte | 50 to 100 mmol·L⁻¹ phosphate, pH 2.5 | Suppresses silanols and keeps basic peptides cationic; raise pH for acidic species |
| Voltage | 20 to 30 kV, positive at the inlet | Reduce if current rises or baseline is noisy |
| Temperature | 25 °C, thermostatted | Stable temperature fixes migration time |
| Injection | Hydrodynamic, low pressure, 3 to 10 s | Keep the plug to a small fraction of capillary volume |
| Sample | 0.5 to 2 mg·mL⁻¹ in water or dilute BGE | Lower ionic strength than BGE gives stacking |
| Detection | UV at 200 nm, with 214 nm as a check | Peptide-bond absorbance; transparent BGE |
| Rinse between runs | 0.1 mol·L⁻¹ NaOH, water, BGE | Resets EOF; shorten only after showing no drift |
| EOF marker | Neutral compound at low concentration | Allows effective mobility and relative migration time |
Orthogonality checklist
- Record the sample, the batch reference and the sequence in the notebook before injection.
- Run a system suitability injection of the reference standard, and record resolution from the nearest impurity, migration-time repeatability and current.
- Calculate corrected area percent for every peak above the reporting threshold, and state the convention.
- Compare impurities between RP-HPLC and CZE by name and approximate size. Mark each as seen by both, by one only, or unexplained.
- Investigate any impurity seen by one method only, with mass spectrometry if needed. A species invisible to one method is the reason for using two.
- Report the CZE result as a purity by an orthogonal method alongside, not instead of, the HPLC result, with both sets of conditions in the record.
References
- Recent developments in capillary and microchip electroseparations of peptides (2019-mid 2021)
- Capillary electrophoretic analysis of proteins and peptides of biomedical and pharmacological interest
- Application of free-solution capillary electrophoresis to the analytical scale separation of proteins and peptides
- Electrophoretic Mobilities of Peptides on Paper and their Use in the Determination of Amide Groups
- SPF: Capillary Electrophoresis (Protein and Nucleic Acid Facility methods page)
- ICH Q2(R2) Validation of analytical procedures — Scientific guideline