instrumentation
Freezer Mapping and Temperature Monitoring: Probes, Excursions and the Record
A freezer holds a temperature field, not a temperature. How to map one, where to place the probes, how door openings distort the trace, and why the display on the front panel is the least useful number available.
A freezer holds a temperature field, not a temperature. The control probe sits in one place, the evaporator sits in another, cold air falls, warm air enters at the door, and the difference between the best and worst positions inside a working cabinet is routinely larger than the tolerance the contents are supposed to be held within. Mapping is the exercise that finds those positions and quantifies the spread; monitoring is what happens afterwards, and it is only as good as the mapping that told it where to put its probe 1. Everything below concerns the equipment and its instrumentation. Contingency planning for loss of supply is a separate discipline and is not covered here.
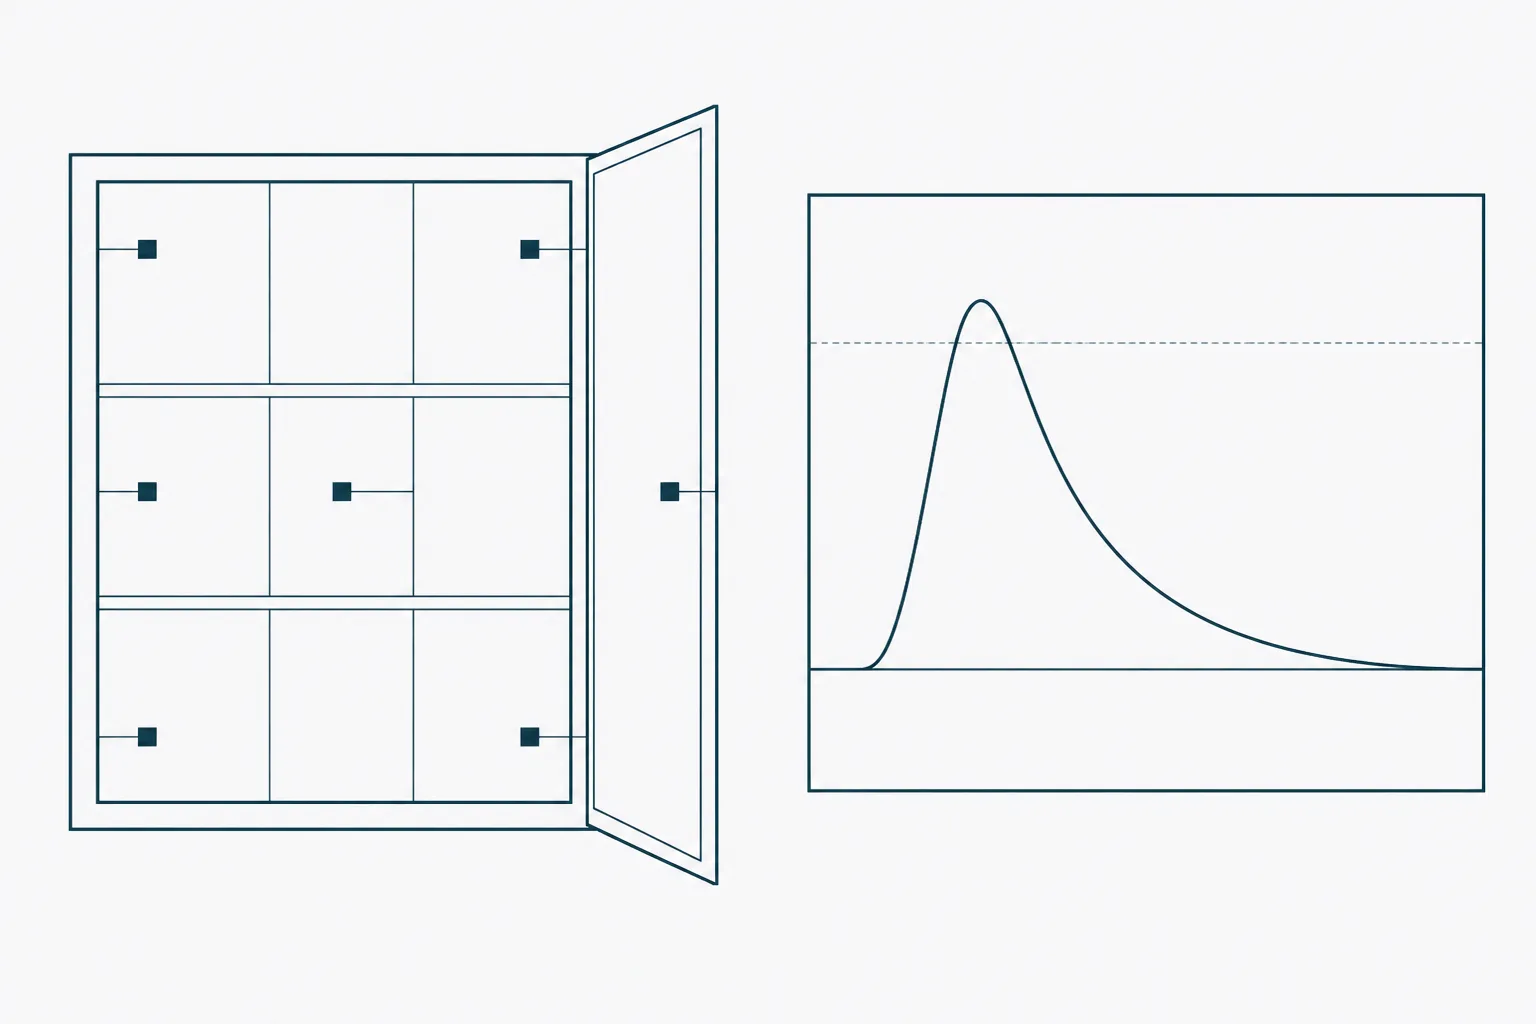
A freezer is not one temperature
Three mechanisms produce the gradient. The first is the refrigeration cycle itself: an evaporator removes heat at one surface, so the air nearest it is coldest and the air furthest from it is warmest, and the difference persists no matter how long the cabinet is left undisturbed. The second is buoyancy, which stratifies the interior top to bottom in an upright cabinet and holds a stable cold layer at the base of a chest cabinet. The third is the door, which is both the largest thermal bridge in the structure and the only part that opens.
Superimposed on the spatial gradient is a temporal one. A compressor-driven cabinet cycles: it cools until the control probe is satisfied, stops, warms until the probe calls again, and repeats. The amplitude of that cycle at the control probe is a design parameter and is usually small. The amplitude elsewhere in the cabinet is not controlled at all, and near the door it can be several times larger. Recorded traces from ultra-low cabinets show both features clearly, with characteristic cycling superimposed on excursions driven by use 4.
The practical consequence is that a nominal set point describes an instrument rather than a storage location. A cabinet set to minus eighty degrees Celsius may hold its coldest shelf several degrees below that and its warmest door-side rack more than ten degrees above it under working conditions, and both positions look identical on a shelf label. Mapping is what turns the cabinet from a single number into a set of qualified locations 13.
The mapping procedure
Mapping is a defined study with a written protocol, a fixed duration, calibrated sensors and a report. It is performed at installation, after relocation, after any repair touching the refrigeration circuit or the door seal, after a change in loading pattern or shelf configuration, and periodically thereafter 3. The sequence below is the standard form for an upright laboratory cabinet.
- Write the protocol first: sensor count and positions, duration, sampling interval, acceptance criteria, and what constitutes a failure.
- Calibrate every sensor against a traceable reference before the study and again afterwards, and record both results. A map produced by uncalibrated sensors is a drawing.
- Bunch all sensors together at ambient temperature and log for several minutes to confirm they agree with each other before separating them.
- Distribute at least nine sensors through the working volume: the eight corners of the usable space and the geometric centre, adding one at the control-probe position and one immediately inside the door.
- Add sensors at every position that theory says will be extreme — top front, bottom rear, adjacent to the evaporator, alongside a defrost element, and any shelf near a vent.
- Run the empty study for a minimum of twenty-four hours undisturbed, sampling at one to five minute intervals, after allowing the cabinet to reach steady state.
- Repeat loaded, with the cabinet filled as it will actually be used, including racks and boxes, and run for at least twenty-four and preferably seventy-two hours.
- Within the loaded run, perform a controlled door-opening challenge of a defined duration at a defined time, and let the cabinet recover fully before the run ends.
- Identify the warmest and coldest positions, the mean kinetic behaviour at each, and the spread between the extremes.
- Report the sensor positions on a diagram, the raw traces, the extremes, the excursion behaviour, and the conclusions about probe placement and unusable locations.
Two decisions in that list carry most of the value. The first is loading: an empty cabinet maps warm and recovers fast, because air has almost no thermal mass, while a full cabinet maps colder and recovers slowly. The loaded study is the one that governs storage decisions, and the empty study exists mainly to characterise the equipment itself 1. The second is duration: twenty-four hours is a minimum that captures several compressor cycles, and seventy-two hours is preferred because it captures a day-night ambient swing and, in most laboratories, at least one defrost event.
Sensor placement is where mapping studies most often go wrong. A probe taped to a shelf measures the shelf; a probe hanging in the airstream measures the air, which changes far faster than anything stored in the cabinet; a probe buried in the middle of a full rack measures a location no sample occupies. Convention is to log air temperature during mapping, because the air is the fastest-moving variable and shows the extremes, and then to place the permanent monitoring probe in a thermal buffer once the map is complete, so that routine monitoring reflects the contents rather than the airstream.
Door openings and recovery
Opening the door does two different things on two different timescales, and confusing them produces both false alarms and missed excursions. On the fast timescale, cold dense air pours out of the base of an upright cabinet and room air is drawn in at the top; the air temperature near the opening rises tens of degrees within seconds. On the slow timescale, the contents themselves absorb heat, and because a frozen vial has far more thermal mass than the air around it, its temperature rises slowly, peaks after the door is shut, and returns over minutes to tens of minutes.
Recovery is not symmetrical with the excursion. The cabinet must remove not only the heat that entered but also the latent heat of the moisture that came in with the room air, which condenses and freezes on every cold surface it reaches. That is why frequent short openings degrade a cabinet faster than an equivalent total time in one long opening: each event deposits ice on the seal, the gasket and the evaporator, and accumulated ice both insulates the evaporator and prevents the door closing cleanly.
| Sensor arrangement | Response to a 30 second opening | What it is useful for |
|---|---|---|
| Bare probe in the airstream near the door | Rises tens of degrees within seconds; returns within minutes | Mapping extremes and detecting a door left ajar |
| Bare probe at the geometric centre | Rises a few degrees; returns quickly | Little; it flatters the cabinet |
| Probe in a thermal buffer at the warmest position | Rises slowly, peaks after closure, decays over minutes | Routine monitoring that reflects the contents |
| Built-in control probe | Small deflection; drives the compressor | Control only; not an independent record |
| Front-panel display | Shows the control probe, often filtered | An operational indication, not a measurement |
The operational controls follow directly from the physics: know what is being retrieved before the door is opened, keep an indexed inventory so that searching happens on paper rather than in the cold, work from racks that come out as a unit, keep the working aliquots in the position the map identified as most stable, and defrost the seal and door frame on a schedule rather than when it stops closing. None of this is exotic, and all of it is visible in the monitoring trace afterwards as a reduction in both the number and the depth of excursions.
Loggers, sampling interval and alarms
A monitoring system is independent of the cabinet's own controller by design, because a controller that has failed cannot be relied on to report that it has failed 2. Independence means a separate sensor, separate electronics, and a record that persists somewhere other than the instrument being monitored. The front-panel display is not a monitoring system: it reports the control probe, it is often smoothed for readability, and it holds no history.
| Parameter | Typical setting | Basis for the choice |
|---|---|---|
| Sampling interval, mapping | 1 to 5 minutes | Must resolve a compressor cycle and a door event |
| Sampling interval, routine | 5 to 15 minutes | Must resolve an excursion without burying it in data |
| Probe position | Warmest mapped location | The position that fails first defines the cabinet |
| Probe medium | Thermal buffer sized to the smallest stored unit | Should follow the contents, not the air |
| Alarm threshold | Set inside the storage limit, not at it | Leaves time to respond before the limit is reached |
| Alarm delay | Long enough to ignore a routine door opening | Suppresses nuisance alarms without hiding faults |
| Sensor calibration | Traceable, on a defined interval | An uncalibrated alarm threshold is arbitrary |
| Data retention | The life of the stored material | The trace must outlast what it certifies |
Alarm design is a balance between two failure modes, and the second is worse than the first. A threshold set too tightly, or a delay set too short, produces alarms during every ordinary retrieval; the result is that alarms get acknowledged reflexively and eventually silenced, and the system stops functioning as a warning at all. A threshold set too loosely produces silence during a genuine slow failure. The standard resolution is a two-stage arrangement: a warning threshold with a short delay for local attention, and an alarm threshold with a longer delay that escalates to a named person, with the delays chosen from the recovery times measured during mapping rather than guessed 2.
Sampling interval interacts with the same trade-off. Sampling every fifteen minutes will miss the peak of a thirty-second door event entirely, which for a probe in a thermal buffer is the correct behaviour, because the contents did not experience that peak either. Sampling every fifteen minutes will also delay detection of a real fault by up to fifteen minutes, which is usually acceptable against the hours a cabinet takes to warm. Mapping at one-minute resolution and monitoring at five to fifteen is the common compromise, and the mapping data is what justifies it 14.
What a mapping record is for
A mapping report is not a certificate that the freezer works. It is the evidence base for a set of decisions that would otherwise be arbitrary, and each decision should be traceable back to a specific figure in it.
- Where the monitoring probe sits, and why that position rather than another.
- Which locations inside the cabinet are qualified for storage and which are excluded.
- What alarm thresholds and delays were set, and from which measured recovery times.
- What the normal spread is, so that a later widening is recognisable as a change.
- What the cabinet's untended behaviour looks like, as a baseline for fault detection.
- When the study must be repeated, and which events trigger an early repeat.
The record also answers the question that arrives long after the fact. When a sample gives an unexpected result, the useful question is not whether the freezer was working but what that specific position was doing during that specific interval, and only a map plus a continuous trace can answer it. A cabinet with a current map, a probe at the mapped worst case and a retained trace can either exclude storage as a cause or date the event that caused it. A cabinet with a front-panel display and a clipboard can do neither, and the ambiguity is permanent 3.
References
- Technical supplement 8: Temperature mapping of storage areas
- Technical supplement 6: Temperature and humidity monitoring systems for fixed storage areas
- Technical supplement 7: Qualification of temperature-controlled storage areas
- Labelled dataset for Ultra-Low Temperature Freezer to aid dynamic modelling and fault detection and diagnostics