verification
HPLC Purity: What the Figure Measures and What It Omits
A purity percentage is one peak's area as a share of the total integrated area, under one method, at one wavelength. This is what that includes, what it leaves out, and how to tell whether a stated figure is interpretable at all.
A peptide purity percentage measures the area of the target peak as a proportion of the total integrated peak area in one chromatographic run — that, and nothing beyond it. It is a ratio among the species one method detected on one sample, not an account of what is in the vial. A figure of 98% says the target accounted for 98% of the detected signal. It does not say that 98% of the weighed mass is target, nor that the other 2% has been identified.
What the number is
The determination is reverse-phase high-performance liquid chromatography with ultraviolet detection. Dissolved sample is injected onto a column packed with a hydrophobic stationary phase and eluted under a gradient of increasing organic solvent. Species partition between the two phases by hydrophobicity and so leave the column at different times. A detector records absorbance against time; software integrates the area beneath each resolved peak, sums those areas, and expresses the target peak as a percentage of the sum.
Three assumptions sit inside that arithmetic and none holds strictly: that every species present elutes within the run window, that every species absorbs at the chosen wavelength, and that the detector responds equally per unit mass to target and impurity. Response factors differ, so an impurity absorbing more strongly than the target is over-represented in the area sum and one absorbing weakly is under-represented. Area-percent is a proxy for mass-percent among detected species, not a measurement of it.
The consequence is easily lost. The denominator is total detected area, not total sample, so anything the method fails to detect leaves both numerator and denominator, and the reported purity rises. A figure can be improved by making the method worse.
Detection wavelength
Wavelength is the most consequential detail on a purity report and the one most often omitted. Detection at 214 nm targets the amide bond of the backbone: every peptide bond contributes, so essentially all peptide material — target, deletion sequences, truncations, modified species — produces signal, roughly in proportion to chain length. Detection at 280 nm targets aromatic side chains: tryptophan strongly, tyrosine much more weakly, and effectively nothing else in a peptide.
Two failure modes follow. Where the target contains no tryptophan and no tyrosine it is effectively invisible at 280 nm, and a purity figure reported there integrates whatever minor aromatic material and baseline noise were present; it means very little. Where the target carries one of those residues but some impurities do not — chains truncated before the aromatic position — the target is detected and those impurities are not, and the apparent purity is flattered.
| Wavelength | What it detects | Failure mode |
|---|---|---|
| 214 nm | The amide bond of the backbone; essentially all peptide material, roughly in proportion to chain length | Solvents and modifiers absorb here too: baseline drift across the gradient, and non-peptide organics can register as peaks |
| 220 nm | The same amide chromophore, more weakly | Lower sensitivity. Small impurity peaks may fall below the integration threshold and leave the sum |
| 280 nm | Tryptophan, and tyrosine weakly. Nothing else in an ordinary peptide | A sequence with neither residue is effectively invisible; impurities lacking them go undetected while the target is detected, inflating purity |
| Diode array, 190–400 nm | The full spectrum at every point in the run | Informative only if the report states which wavelength the quoted figure came from |
A figure with no stated wavelength cannot be interpreted. A figure at 280 nm for a sequence lacking both residues is not a weaker measurement of the same quantity; it is a measurement of a different one.
Why a figure without a method is not comparable
Separation is a physical resolution problem, and every method parameter moves the answer. A shallow gradient spreads the elution window and resolves species a steep gradient merges — and a merged pair integrates as one peak and reports as higher purity. Column chemistry, particle size and pore size change selectivity, meaning the order and spacing of the peaks. Flow rate and column temperature change peak width. Run length decides whether strongly retained species elute at all.
The figure is a joint property of the sample and the method. The same batch run by two laboratories under two methods yields two numbers, neither wrong. A percentage quoted without its method cannot be compared with another, and a rise between two reports may record a change of method rather than of material. For comparability a report must state the following.
- Column: stationary phase chemistry, dimensions, particle and pore size.
- Mobile phases and the ion-pairing modifier.
- The gradient programme in full, and the total run time.
- Flow rate and column temperature.
- Injection quantity, which decides whether the detector was inside its linear range.
- Detection wavelength.
- The chromatogram itself, not only the integrated result.
What the method cannot see
Four categories sit outside a UV area-percent determination: species that do not absorb at the detection wavelength, species that co-elute with the target, species retained on the column and never eluted, and inorganic content. None enters the numerator or the denominator, so none reduces the figure.
| Content | Why it is absent from the trace | Effect on the figure |
|---|---|---|
| Non-absorbing species | Inorganic salts and some small organics carry no chromophore at peptide wavelengths | Contribute vial mass and no peak area |
| Co-eluting species | Not resolved from the target, so integrated inside the main peak | Added straight to the numerator; purity rises as resolution falls |
| Column-retained material | Hydrophobic or aggregated species not eluted within the gradient | Absent from numerator and denominator alike |
| Water | Not chromophoric; determined by Karl Fischer titration | Counts as vial mass, never as peak area |
| Counterion | Trifluoroacetate from synthesis and purification; no UV response at peptide wavelengths | Contributes to gross weight; needs a separate determination or an exchange step |
Purity and net peptide content are therefore two measurements, not two expressions of one. Purity is a ratio among detected peptide-related species. Net peptide content is the proportion of the weighed mass that is peptide rather than water, salt and counterion, determined by amino acid analysis or nitrogen determination. Trifluoroacetate carried through synthesis and purification persists in the isolated solid and is removed only by a deliberate exchange procedure, itself an optimisation problem 3. A batch can honestly report a high area-percent purity and a much lower peptide content by weight; the two answer different questions.
Deletion sequences and co-elution
Solid-phase synthesis assembles a chain stepwise on an insoluble support, coupling one protected residue at a time 4. Coupling is not quantitative at every step. Where a coupling fails and the unreacted site is not capped, the chain resumes at the next cycle and the finished product lacks one internal residue: a deletion sequence. Where chains stop and are capped, the product is a truncation. These are the characteristic impurities of the route, closely related to the target by construction.
Retention in reverse-phase chromatography follows overall hydrophobicity. Removing one residue from a chain of twenty or thirty alters that only slightly, especially where the missing residue is small or polar, so a deletion sequence elutes close to the target and sometimes is not separated from it. The most abundant synthesis-related impurity is also the hardest to resolve from the peak it is measured against.
Hence the integration problem: close-eluting impurities are the ones most likely to be counted into the main peak. Where two species resolve to baseline, integration software drops a perpendicular at the valley and reports two peaks; where they merge into a shoulder it may split at the inflection, or find no valley and report one peak with the impurity area inside it. The percentage does not announce which happened. Peak symmetry and a clean return to baseline are the visible evidence of resolution — the thing area-percent assumes without stating.
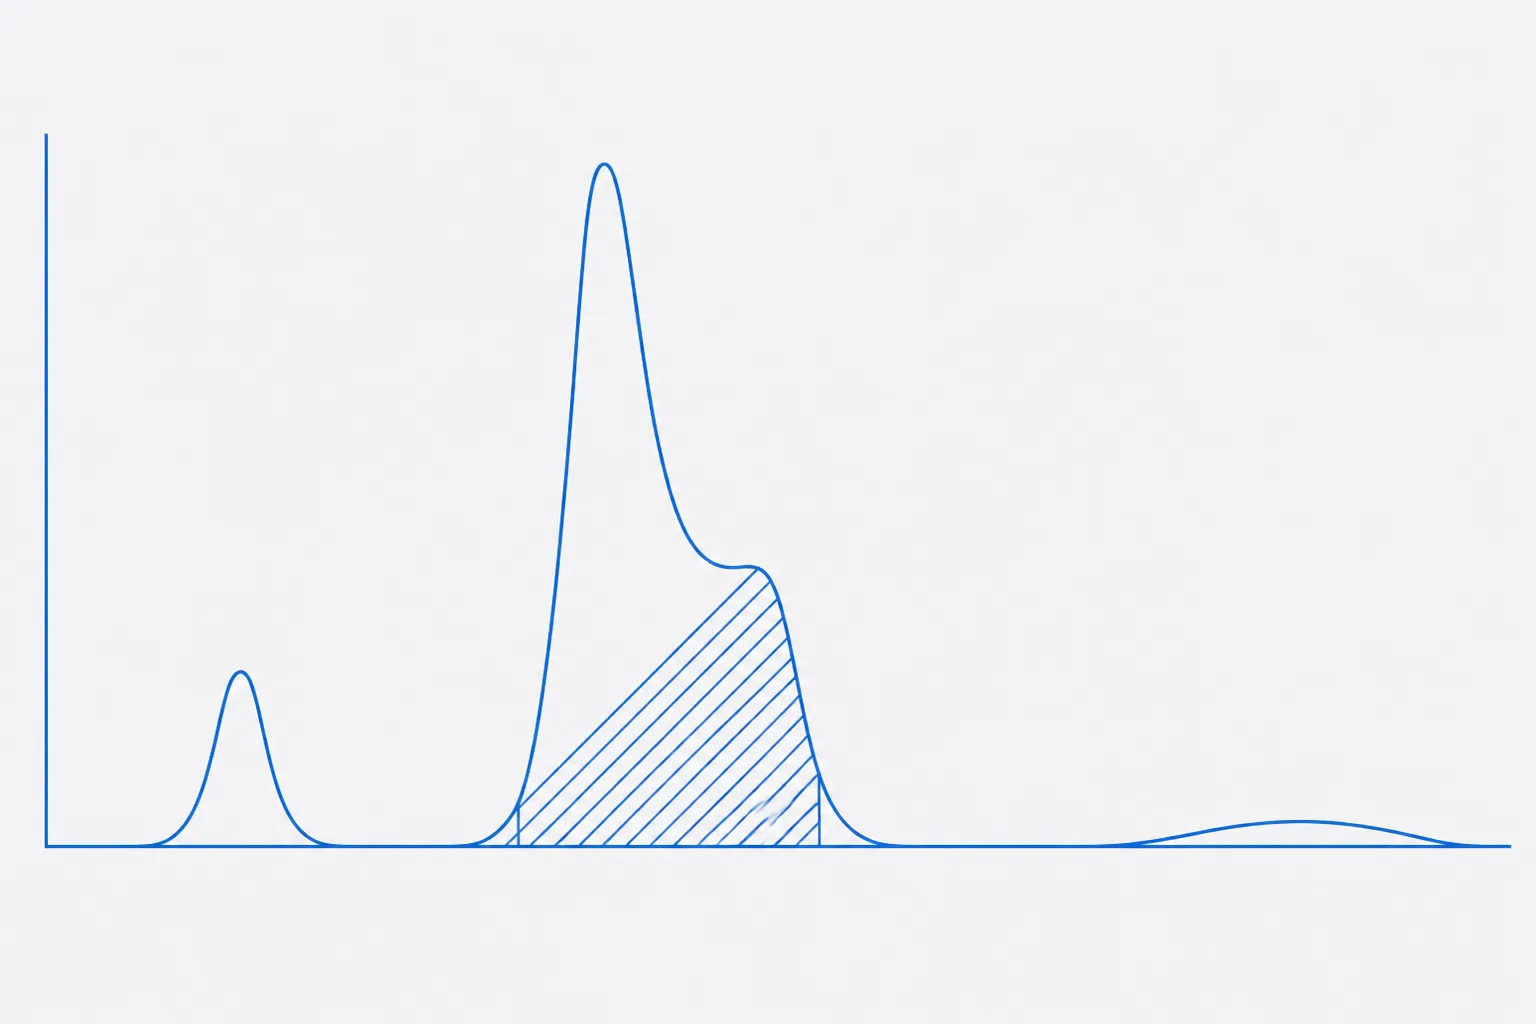
Deletion and truncation species differ from the target in mass, which is why mass-spectrometric detection resolves what ultraviolet detection cannot: a co-eluting deletion sequence sits under the same peak but carries a different mass. That information exists only if the analysis was run that way.
Area-percent against an orthogonal method
An orthogonal method separates or detects on a different physical principle, so its blind spots do not coincide with those of the first. Agreement between two methods that fail differently raises confidence; disagreement localises the problem rather than merely casting doubt.
A second method at a different mobile-phase pH, or on a different stationary phase, re-orders the peaks and separates pairs that co-eluted under the first conditions. Liquid chromatography coupled to mass spectrometry assigns a mass to each eluting species and identifies what the ultraviolet trace only counts. Amino acid analysis quantifies peptide against the weighed mass; Karl Fischer titration returns water; ion chromatography returns counterion.
Against that set, a single area-percent figure at one wavelength under one unstated method is the weakest available evidence — and the cheapest to produce, which is why it is so often the only one reported. Area-percent describes how the detected signal was distributed; an orthogonal determination reports something the first method could not have seen.
What published analyses report
A 2015 study in Talanta analysed illegal peptide biopharmaceuticals of the kind frequently encountered by controlling agencies, applying chromatographic and mass-spectrometric methods to characterise what the products contained, and reported that the composition of the samples examined varied and did not consistently correspond to what was declared for them 1. A 2018 study in the same journal profiled the impurities in the falsified polypeptide drugs most frequently encountered on the Belgian market, and reported that detailed impurity profiles could be established for those products and that the profiles differed between them 2.
Two cautions. Each study describes the particular samples its investigators obtained; neither supports a proportion generalised to any market, and none is offered here. What they establish is narrower and sufficient: a stated purity figure is a claim about a batch, made by whoever performed the analysis, and divergence between such a claim and an independent measurement is documented rather than theoretical.
Assessing a stated purity figure
- Identify the batch the figure refers to, and confirm that identifier appears on the container in hand.
- Find the detection wavelength. If it is not stated, stop — no later step recovers the figure.
- Read the sequence for tryptophan and tyrosine. If it contains neither and the figure was recorded at 280 nm, discard it.
- Confirm the method is stated in full: column, mobile phases, gradient, flow rate, temperature, injection quantity, run time.
- Obtain the chromatogram, not only the number. A percentage without its trace cannot be checked.
- Inspect the main peak for symmetry, shoulders on either flank, and a clean return to baseline. A raised flank means unresolved material inside the integration window.
- Confirm the peak is not flat-topped. A saturated detector under-reports its area and distorts every ratio taken from the run.
- Confirm the run continues well beyond the target's elution. A truncated gradient cannot report late-eluting species.
- Check whether net peptide content, water and counterion are reported separately. Without them the figure says nothing about the mass in the vial.
- Record the analysis date with the figure. It describes the batch at the point of measurement.
- Where the result carries weight, commission an orthogonal determination on the sample in hand.
Applied honestly, this disqualifies many circulating purity figures at step two or step three, before any question of the material itself arises. That is the correct outcome: an uninterpretable figure is not weak evidence of purity, it is no evidence, and treating it as a low-confidence version of a real measurement is the error the exercise exists to prevent.
References
- Analysis of illegal peptide biopharmaceuticals frequently encountered by controlling agencies
- Impurity profiling of the most frequently encountered falsified polypeptide drugs on the Belgian market
- Optimization of the hydrochloric acid concentration used for trifluoroacetate removal from synthetic peptides
- Solid Phase Peptide Synthesis. I. The Synthesis of a Tetrapeptide