preparation
Net Peptide Content and Gross Weight
The mass printed on a vial is total solid, not peptide. This is what makes up the difference, how the peptide fraction is determined, and how to carry it through a concentration calculation.
Net peptide content is the fraction of a lyophilised solid's total mass that is actually peptide, stated as a percentage. Gross weight is the other quantity: the total mass of dried solid in the container, everything included. The two are not the same number and are rarely close. For synthetic material purified by reverse-phase chromatography, net peptide content commonly falls in the region of 70–90%, varying with sequence, purification route and drying conditions 3. The balance is counterion, residual water and residual salt. A concentration derived from gross weight alone is high by the size of that gap, and the error is systematic.
Definitions
Three quantities are routinely conflated in handling records. They are measured by different methods, describe different denominators, and cannot be substituted for one another.
| Quantity | What it describes | Denominator | Usual method |
|---|---|---|---|
| Gross weight | Total mass of dried solid in the container | Whole contents | Gravimetric, at fill |
| Net peptide content | Peptide mass as a fraction of total solid | Whole contents | Quantitative amino acid analysis |
| Peptide purity | Target sequence as a fraction of peptide-related material | Peptide only | RP-HPLC, detection at 214 nm |
| Free-base mass | Peptide mass excluding associated counterion | Peptide only | Derived from content and counterion assay |
Gross weight is set by a balance at the fill step, and the balance registers everything in the pan. It does not distinguish peptide from trifluoroacetate, adsorbed water or salt carried through the process. Fill tolerance is a separate matter and does not narrow the gap: a fill accurate to ±2% of a solid that is 78% peptide is still 22% not peptide.
Composition of the lyophilised solid
The non-peptide mass has three ordinary sources. Counterions dominate, residual water is next, and salt carried from purification and buffer exchange makes up the remainder.
Counterions arrive with the purification. Solid-phase synthesis, in the form established by Merrifield, builds the chain on a resin and releases it by acidolysis; the crude product is then resolved by reverse-phase chromatography 2. The standard mobile-phase modifier is trifluoroacetic acid, which suppresses silanol interaction and sharpens peaks. It also pairs with every protonated basic site and stays with the peptide through lyophilisation, so the isolated solid is a trifluoroacetate salt, not a free base 1.
Residual water is the second contributor, with two distinct origins that are frequently merged. The first is incomplete drying: water not removed during primary and secondary drying and still held in the cake. The second is hygroscopic uptake afterwards — lyophilised cakes draw moisture from room air within seconds of a vial being opened cold. Moisture content is therefore not a fixed property of the batch. It moves with handling, and it governs solid-state stability, since water mobilises the degradation routes that dry solid suppresses 4.
Residual salts are the third. Buffer components, ion-exchange residues and neutralisation products are non-volatile and survive lyophilisation. Their contribution is normally the smallest of the three, but rises where a counterion exchange or desalting step has been performed without adequate downstream removal.
Counterion load
Trifluoroacetate load is not a constant percentage. It scales with the number of protonatable basic sites: arginine, lysine and histidine side chains and the free N-terminal amine, with acidic side chains and the C-terminal carboxylate working the other way. A sequence rich in basic residues therefore carries proportionally more counterion than a neutral or acidic sequence of the same length, and two peptides of identical molecular weight can differ by ten percentage points of net content on composition alone 1.
The arithmetic is direct. Trifluoroacetic acid has a molar mass of 114 g·mol⁻¹. One equivalent per basic site, added to a free base of 1,570 g·mol⁻¹, gives the following illustrative series.
| Basic sites | Counterion mass per mole | Mass of the salt | Counterion as % of salt mass |
|---|---|---|---|
| 0 | 0 g | 1,570 g | 0.0% |
| 1 | 114 g | 1,684 g | 6.8% |
| 2 | 228 g | 1,798 g | 12.7% |
| 3 | 342 g | 1,912 g | 17.9% |
| 4 | 456 g | 2,026 g | 22.5% |
| 5 | 570 g | 2,140 g | 26.6% |
Counterion identity matters beyond mass accounting. Trifluoroacetate is cytotoxic at concentrations reached in ordinary cell culture work, inhibiting proliferation in several standard lines well below the levels a naive dilution would produce. Where the assay is sensitive to it, the salt is exchanged for acetate or hydrochloride, typically by repeated lyophilisation from dilute hydrochloric acid or by ion exchange 1. Exchange changes the counterion mass and so changes net peptide content: a certificate issued before exchange does not describe the material after it.
Purity and net content are different measurements
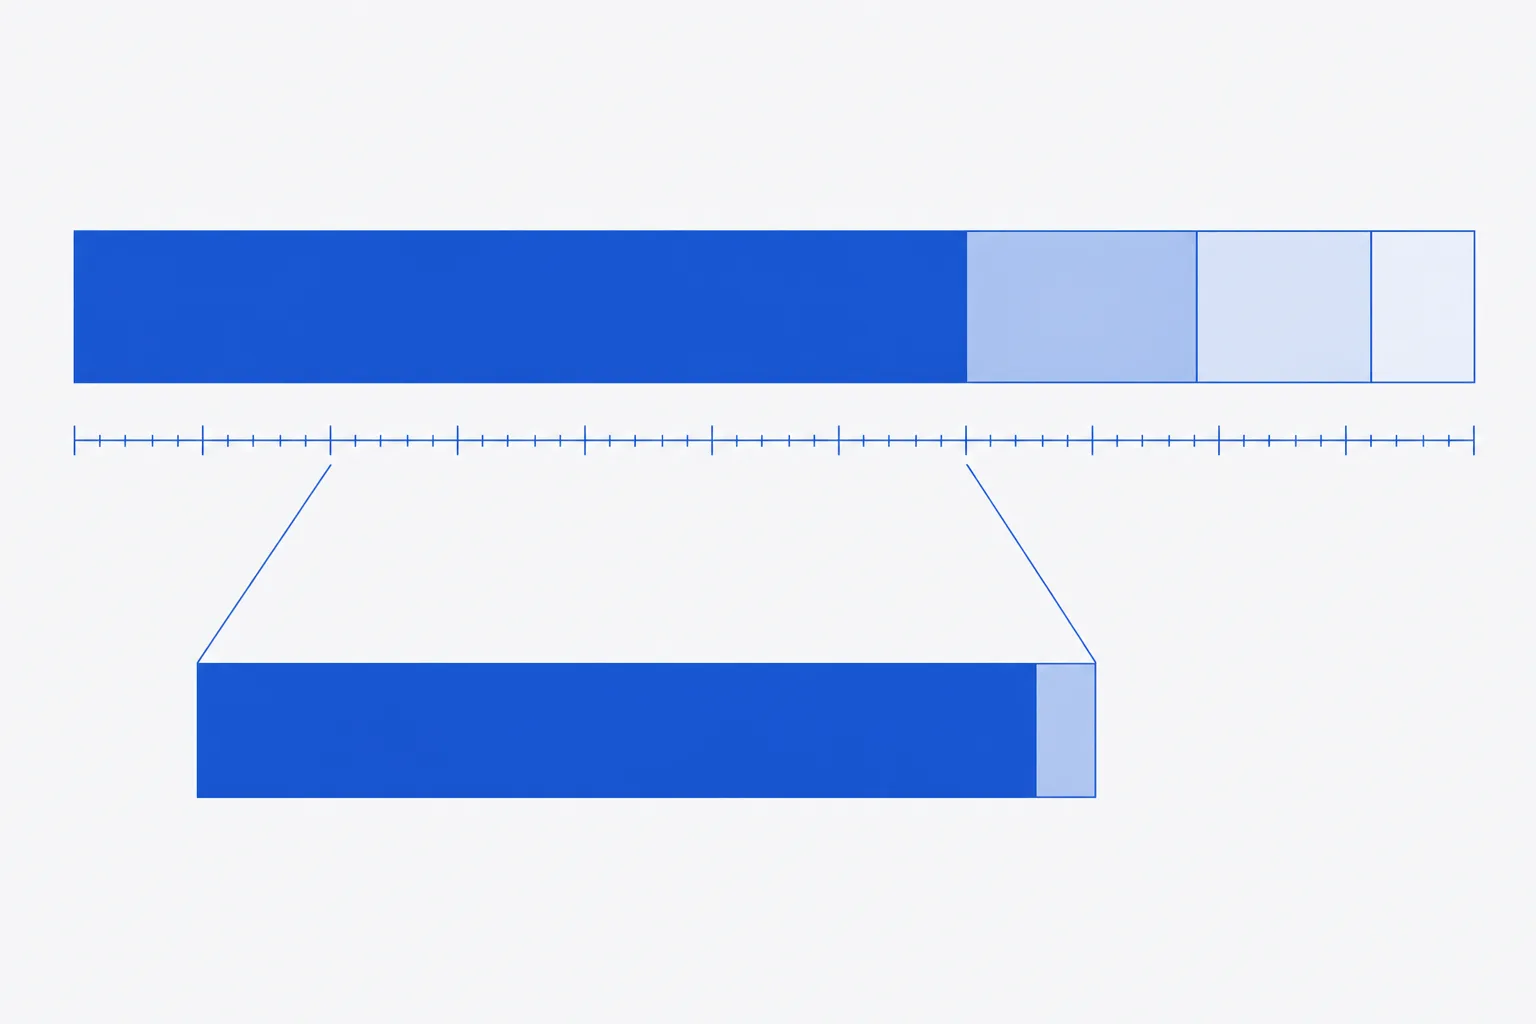
This is the distinction conflated most often. Purity, usually reported by RP-HPLC as a percentage of integrated peak area, describes what fraction of the peptide-related material is the target sequence. Net peptide content describes what fraction of the total mass is peptide at all. The first has peptide as its denominator; the second has the whole solid. A high figure for one implies nothing about the other.
A preparation can be 98% pure and 75% peptide by mass at the same time, with no inconsistency. Purity is blind to counterion, water and salt, none of which appear as peaks at the detection wavelength used. A single clean peak at 98% area confirms that deletion sequences, truncations and oxidised forms are minor. It says nothing about how much of the powder in the vial is peptide.
Work the illustration through a nominal 10.0 mg of solid at 98% purity and 75% net content. Peptide mass is 7.50 mg, of which 98% — 7.35 mg — is target sequence and 0.15 mg is peptide-related impurity. The remaining 2.50 mg is not peptide. The vial therefore holds 7.35 mg of the intended molecule in 10.0 mg of solid, 73.5% of gross weight, on a purity figure of 98%.
| Component | Mass | % of gross weight | Counted in purity? |
|---|---|---|---|
| Target sequence | 7.35 mg | 73.5% | Yes — the 98% |
| Peptide-related impurities | 0.15 mg | 1.5% | Yes — the other 2% |
| Trifluoroacetate counterion | 1.50 mg | 15.0% | No |
| Residual water | 0.70 mg | 7.0% | No |
| Residual salts | 0.30 mg | 3.0% | No |
| Total | 10.00 mg | 100.0% | — |
Determination methods
Net peptide content must be measured. It cannot be inferred from purity, appearance or recovered mass. Four methods are in general use, with quantitative amino acid analysis as the reference against which the others are judged.
| Method | What is measured | Requirement | Principal limitation |
|---|---|---|---|
| Quantitative amino acid analysis | Molar quantity of each residue after total hydrolysis | Hydrolysis in 6 mol·L⁻¹ HCl, 110 °C, 24 h; internal standard | Destructive and slow; tryptophan and cysteine are degraded and excluded from the calculation |
| Nitrogen determination | Total nitrogen, converted by a sequence-derived factor | Known sequence; nitrogen-free excipients and buffers | Any nitrogenous impurity is counted as peptide |
| Absorbance at 280 nm | Chromophore concentration via molar extinction coefficient | At least one tryptophan or tyrosine residue | Returns nothing usable for a sequence containing neither |
| Gravimetric after exhaustive drying | Solid mass corrected for water only | Vacuum drying to constant mass | Does not resolve counterion or salt; yields an upper bound |
Two cautions on the alternatives. Nitrogen determination attributes all measured nitrogen to peptide, so ammonium salts, residual coupling reagents and nitrogenous buffers inflate the result. Absorbance at 280 nm depends entirely on aromatic side chains, the extinction coefficient being calculated from tryptophan, tyrosine and cystine content. A sequence containing none of these has no absorbance there, and the method fails outright rather than returning a poor figure. Check the sequence first.
Worked calculation
The following runs a generic sequence from stated gross mass to a solution concentration. Every figure is chosen for arithmetic clarity and is illustrative only; none describes a real preparation. Substitute the values from the batch certificate in hand.
- Record the stated gross mass. Illustrative figure: 10.0 mg of lyophilised solid.
- Record the stated net peptide content and its source. Illustrative figure: 78.5%, by amino acid analysis, from the batch certificate.
- Compute peptide mass. 10.0 mg × 0.785 = 7.85 mg.
- Take the molecular weight of the free base, not the salt. Illustrative figure: 1,570 g·mol⁻¹. Using the salt mass here double-counts the counterion already removed at step 3.
- Compute molar quantity. 7.85 × 10⁻³ g ÷ 1,570 g·mol⁻¹ = 5.00 × 10⁻⁶ mol = 5.00 µmol.
- Record the solvent volume as delivered — verified gravimetrically or by calibrated pipette — not as nominal. Illustrative figure: 2.00 mL.
- Compute molar concentration. 5.00 µmol ÷ 2.00 mL = 2.50 µmol·mL⁻¹ = 2.50 mmol·L⁻¹.
- Cross-check by mass. 7.85 mg ÷ 2.00 mL = 3.93 mg·mL⁻¹ of peptide, against 5.00 mg·mL⁻¹ of total dissolved solid.
- Record both concentrations, the content figure and the molecular weight basis in one entry. A concentration without its assumptions is not reproducible.
The error avoided is worth quantifying. Treating the full 10.0 mg as peptide gives 10.0 × 10⁻³ g ÷ 1,570 g·mol⁻¹ = 6.37 µmol, and in 2.00 mL that is 3.18 mmol·L⁻¹ — 27% above the corrected 2.50 mmol·L⁻¹. The deviation is systematic, not random. It does not average out across replicates, it propagates unchanged into every serial dilution from the stock, and no internal consistency check will find it, because every dilution is wrong by the same factor.
| Step | Corrected | Gross mass assumed to be peptide |
|---|---|---|
| Solid taken | 10.0 mg | 10.0 mg |
| Peptide mass used | 7.85 mg | 10.0 mg (assumed) |
| Molar quantity at 1,570 g·mol⁻¹ | 5.00 µmol | 6.37 µmol |
| Concentration in 2.00 mL | 2.50 mmol·L⁻¹ | 3.18 mmol·L⁻¹ |
| Mass concentration of peptide | 3.93 mg·mL⁻¹ | 5.00 mg·mL⁻¹ (nominal) |
| Deviation from corrected value | — | +27% |
When net peptide content is not stated
A certificate reporting purity but not net peptide content is common. It does not permit the calculation above to be completed, and the correct response is to make the gap explicit rather than fill it with a guess. Treat the stated gross mass as an upper bound on peptide mass: the true value is at or below it, usually well below, and no other bound follows from the data supplied.
Applying a nominal correction — assuming 80% because that is typical — produces a number that looks defensible and is not. The plausible range spans roughly 70–90%, wider still for highly basic sequences, so an assumed midpoint carries an undeclared uncertainty of well over ten percentage points. If a working assumption must be made, state it and its basis alongside every concentration derived from it, and label those concentrations nominal throughout.
The consequence for comparison is absolute. Two preparations of the same sequence from different sources, both labelled 10 mg, may hold materially different quantities of peptide, and without content figures for both there is no way to know the direction or size of the difference. Quantitative comparison between them is not possible; any concentration–response or potency figure spanning the two is confounded by an unmeasured mass term. Where such a comparison is required, obtain content figures for both or determine content in house before generating the data, not after 3.
Recording procedure
Every stated concentration rests on a chain of assumptions, and the chain is not recoverable later unless it was written down at the time. Record the following against each stock prepared.
- Batch or lot identifier, and the date of the certificate the figures came from.
- Stated gross mass, and whether it is a fill weight or a mass weighed in house.
- Stated net peptide content, the method used, and whether it was supplied or assumed. If assumed, record the value and the reason.
- Purity figure, method and detection wavelength — recorded separately from content, never in place of it.
- Counterion form, and whether an exchange has been performed since the certificate was issued.
- Molecular weight used, stated explicitly as free base or as salt.
- Solvent identity, grade and delivered volume, with the method used to verify the volume.
- Derived peptide mass, molar quantity and final concentration, each with its unit.
- Date, time and operator; for any figure inherited from an earlier record, a reference to that record rather than a copied value.
- Re-derive the whole chain rather than carrying figures forward whenever an input changes — a new lot, a counterion exchange, a revised certificate.
The discipline is narrow but load-bearing. A concentration is a claim about how many molecules are present per unit volume, and that claim rests on a mass fraction no balance can see. Record the fraction with the result and the result stays interpretable after the vial is empty.