preparation
Stock Solutions and Dilution Series: Concentration Arithmetic
One weighing carried into a whole concentration range by volumetric transfer. Molar and mass concentration, serial versus direct dilution, solvent carry-over, and a worked series.
A peptide stock solution is prepared by dissolving a known mass of peptide in a measured volume of a solvent that will hold it, computing the concentration from peptide mass rather than gross mass, and producing every working concentration from it by measured dilution. The reason is arithmetic. Balance error is near-constant in absolute terms and so proportionally largest at the smallest masses; weighing once at the largest practical mass puts the whole range on the precision of a pipette rather than a balance at its limit.
Why work from a stock
A balance with a readability of 0.1 mg carries a realistic weighing uncertainty near ±0.2 mg in practice. Against 20.0 mg that is ±1%. Against 2.0 mg it is ±10%. Against 0.2 mg it is not a measurement. The absolute error does not fall with the target, and peptide is routinely handled in single-digit milligrams.
A stock converts one weighing into a whole range. Volumetric transfer at ordinary volumes is accurate to well under one per cent, an order better than the gravimetric route at low mass. It also fixes composition: every point descends from the same dissolved material, so a dissolution failure or a content error appears as one offset across the range rather than as scatter.
The corollary is that a stock error is unrecoverable within the series. It multiplies through every dilution unchanged, and no internal check finds it, because every point is wrong by the same factor. Verify the stock rather than the arithmetic: confirm the delivered volume gravimetrically, and the concentration by absorbance or a colorimetric assay where the sequence permits.
Molar and mass concentration
Two scales answer different questions. Mass concentration — mg·mL⁻¹, equivalently g·L⁻¹ — states how much material is present. Molar concentration states how many molecules are present, and anything depending on occupancy of a binding site responds to that figure. Record both; each is the one somebody later needs.
The conversion is division by molecular weight: c (mol·L⁻¹) = ρ (g·L⁻¹) ÷ M (g·mol⁻¹). Two corrections precede it and neither is optional. Use the free-base molecular weight, not that of the salt, since the counterion — generally trifluoroacetate from purification — is not part of the molecule being counted 1. And apply net peptide content to the weighed gross mass first, a correction set out with its determination in the companion reference on net peptide content and gross weight.
Illustrative throughout: a stock at 2.50 mmol·L⁻¹, equivalent to 3.93 mg·mL⁻¹ of peptide at a free-base molecular weight of 1,570 g·mol⁻¹. Arithmetic, not measurements. The scales do not track one another between sequences — peptides in ordinary use span roughly 500 to 5,000 g·mol⁻¹ 4 — so two preparations at 1.00 mg·mL⁻¹ can differ tenfold in molar concentration.
The dilution relation
Dilution conserves the quantity of solute. Stated once: C₁V₁ = C₂V₂, where C₁ and V₁ are the concentration and volume taken from the more concentrated solution and C₂ and V₂ those of the result. Rearranged for use, V₁ = C₂V₂ ÷ C₁.
One slip accounts for most errors in applying it. V₂ is the total volume of the result, not the volume of diluent added; diluent is V₂ − V₁. Adding V₂ of diluent to V₁ of stock gives a solution more dilute than intended by (V₁ + V₂) ÷ V₂.
Applied once, in the units used below. For 1.00 mL at 50.0 µmol·L⁻¹ from a stock at 2.50 mmol·L⁻¹ — that is, 2,500 µmol·L⁻¹ — V₁ = (50.0 × 1.00) ÷ 2,500 = 0.0200 mL. Take 20.0 µL of stock, add 980 µL of diluent: 1.00 mL at 50.0 µmol·L⁻¹.
Serial and direct dilution
Two routes reach a set of concentrations. A serial dilution applies a fixed factor repeatedly, each point made from the point above it. A direct dilution makes each point independently from the stock. Error propagation decides between them.
| Property | Serial | Direct from stock |
|---|---|---|
| Transfer volumes | Constant and comfortably large | Fall steeply as the target concentration falls |
| Random error | Accumulates in quadrature: about √n × the per-step error | Independent at each point |
| Systematic error | Compounds geometrically: +2% per transfer is +13% by the sixth point | Reproduced once per point, not multiplied |
| Range in one arrangement | Effectively unlimited; a factor of five spans 15,625-fold in six steps | About 500-fold, bounded by the smallest accurate transfer |
| Failure mode | One bad step shifts every point below it | One bad point stands alone as an outlier |
Random error accumulates in quadrature: at 1% per transfer, the sixth point carries roughly √6 × 1%, under 2.5%. Systematic error behaves worse. A pipette delivering 2% high applies that factor at every step, so the sixth point is high by 1.02⁶, about 13%. The distortion is monotonic, so it appears not as scatter but as a smoothly shifted curve.
Direct dilution removes the compounding — an error stays at its own point and shows as an outlier — but cannot remove small volumes. One step is bounded by the smallest accurate transfer against the largest practical final volume: roughly 500-fold for 2 µL into 1.00 mL. Below about 2 µL the error of an air-displacement pipette rises steeply and dominates every other term, a 0.1 µL offset being 5% of 2 µL against 0.5% of 20 µL. Spanning four orders of magnitude directly therefore needs an intermediate anyway.
The resolution is the hybrid used below: one measured step from stock to an intermediate, then a serial series with transfers large enough to keep per-step error small.
Worked serial dilution
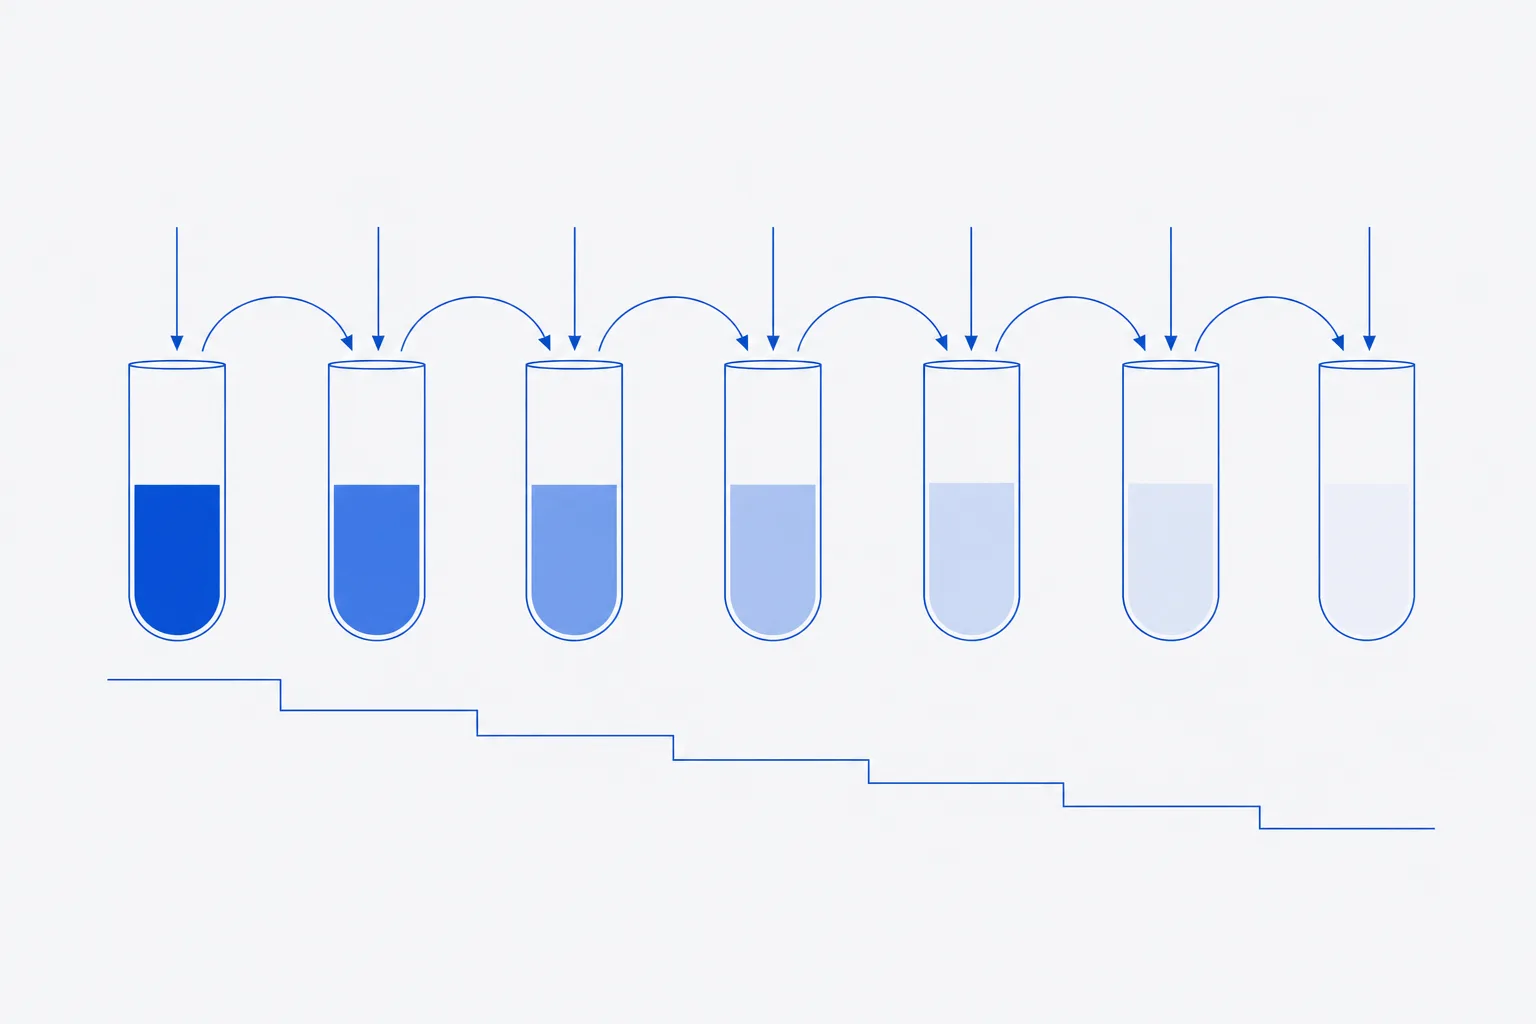
The series below produces seven concentrations from 50.0 µmol·L⁻¹ down to 3.20 nmol·L⁻¹ — a span of 15,625-fold — at a constant factor of five. Illustrative arithmetic only. Transfers are 200 µL throughout, two orders of magnitude above the volume at which pipetting error becomes the dominant term.
| Tube | Transferred | Diluent | Total volume | Cumulative factor | Concentration |
|---|---|---|---|---|---|
| A, intermediate | 20.0 µL of stock | 980 µL | 1.00 mL | 50 | 50.0 µmol·L⁻¹ |
| B | 200 µL of A | 800 µL | 1.00 mL | 250 | 10.0 µmol·L⁻¹ |
| C | 200 µL of B | 800 µL | 1.00 mL | 1,250 | 2.00 µmol·L⁻¹ |
| D | 200 µL of C | 800 µL | 1.00 mL | 6,250 | 400 nmol·L⁻¹ |
| E | 200 µL of D | 800 µL | 1.00 mL | 31,250 | 80.0 nmol·L⁻¹ |
| F | 200 µL of E | 800 µL | 1.00 mL | 156,250 | 16.0 nmol·L⁻¹ |
| G | 200 µL of F | 800 µL | 1.00 mL | 781,250 | 3.20 nmol·L⁻¹ |
Two points of practice sit inside that table. Each tube is left 200 µL short once its transfer has been taken, so make each up at the volume actually needed downstream. And the cumulative factor column checks the chain: 2,500 µmol·L⁻¹ ÷ 781,250 returns 3.20 nmol·L⁻¹ independently of any intermediate value.
Solvent carry-over
Solvent travels with the peptide. If the stock is in DMSO, every point contains DMSO, and the proportion is set by the dilution scheme rather than chosen. Tube A holds 20.0 µL of DMSO in 1.00 mL — 2.00% v/v. With a DMSO-free diluent, tube B holds 0.400%, tube C 0.0800%, tube G 0.000128%. Solvent then varies by the same 15,625-fold factor as the peptide: a second variable moving in exact step with the first.
Match the diluent instead. Prepare it containing DMSO at the proportion the top point requires — 2.00% v/v here — and every tube holds 2.00% regardless of position. Only peptide concentration then varies. The cost is that the whole series sits at the top point's solvent proportion, which must therefore be acceptable before anything is prepared.
The figure that matters is the proportion in the final assay volume, not in the tube. Adding 100 µL of each tube to 900 µL of assay medium divides both terms by ten: DMSO falls to 0.200% v/v and the peptide range becomes 5.00 µmol·L⁻¹ to 0.320 nmol·L⁻¹. Calculate that before preparing anything and compare it with the assay's tolerance — commonly 0.5% v/v or below for cell-based work. A series whose top point exceeds it must be redesigned, not rescued afterwards.
Run a vehicle control at the matched final solvent concentration: diluent at 2.00% carried through the identical final dilution to 0.200%. Without it, any effect at the top of the range is attributable to peptide and solvent jointly. The counterion is a passenger of the same kind — trifluoroacetate arrives in proportion to the peptide, at concentrations not always negligible, which is why exchange to acetate or hydrochloride is performed where the system is sensitive to it 1.
Adsorption at the dilute end
Loss to surfaces behaves closer to a fixed quantity per unit area of contacted surface than to a fixed fraction, so its proportional effect grows as the solution becomes more dilute. At the bottom of a wide series, an absolute loss that was immaterial at the top removes a substantial fraction of what is present 2. The signature is a series flattened at the dilute end, easily misread as a property of the response.
The controls are those set out in the companion reference on solvent selection and dissolution: low-binding polypropylene, a carrier protein or non-ionic surfactant in the diluent where the assay permits, minimum contact time, and identical labware across every point compared 2. Consistency matters more than the particular choice.
Mixing
A dilution is not made until it is mixed. A small aliquot delivered into a diluent does not distribute itself on any useful timescale, particularly if it differs in density or was delivered onto the tube wall. Drawing the next transfer from an unmixed tube samples an unknown concentration, and in a serial arrangement that error propagates to every point below.
Mix by gentle inversion — five to ten inversions of a capped tube, or slow aspiration and expulsion with the tip below the liquid surface. Vortexing mixes by a route that costs material: it generates shear and a continually renewed air–liquid interface at which peptides adsorb, partially unfold and desorb as aggregation-competent species, agitation being among the better-characterised drivers of aggregation 3. Foam is the marker. Change the tip at every step, or it carries more concentrated solution into the next tube on its exterior.
Preparation procedure
- Fix the target stock concentration first, from the top of the required range and the intended scheme.
- Weigh at the largest practical mass; prepare a larger stock volume rather than weighing less material.
- Convert gross mass to peptide mass using the stated net peptide content, and take the free-base molecular weight.
- Dissolve in the smallest volume of a solvent the sequence will enter, then bring to final volume. Verify that volume gravimetrically.
- Compute and record the stock concentration in both molar and mass terms.
- Aliquot the stock into single-use volumes before any dilution is drawn from it.
- Calculate the whole series on paper first: transfer volume, diluent volume, total volume, cumulative factor and concentration at every point.
- Calculate the solvent proportion at every point and in the final assay volume, and check it against the assay's tolerance before preparing anything.
- Prepare the diluent with solvent at the matched proportion, and a vehicle control at the matched final concentration.
- Label tubes before pipetting, keep transfers within the pipette's accurate range, mix each tube by inversion before drawing from it, and change the tip between steps.
- Record: batch identifier, net peptide content and molecular weight basis, solvent and grade, verified stock volume and concentration in both units, the dilution table as executed with any departure from plan, the final solvent proportion, labware, and date and operator.
The last entry decides whether the series stays usable. A concentration recorded without its dilution scheme can be neither reproduced nor corrected. If the stock is later found to be wrong — a revised content figure, a counterion exchange, a re-measured volume — a recorded chain lets every derived concentration be recomputed. Without it, the series goes with the data it produced.
References
- Optimization of the hydrochloric acid concentration used for trifluoroacetate removal from synthetic peptides
- The importance of using the optimal plasticware and glassware in studies involving peptides
- Instability, stabilization, and formulation of liquid protein pharmaceuticals
- Trends in peptide drug discovery