qNMR for Peptide Content: Internal Standards and Limits
Quantitative proton NMR assigns the absolute content of a weighed peptide by comparison with a certified internal standard, without a peptide reference material and without destroying the sample. The equation, a worked example, the acquisition settings that decide accuracy, and how the result compares with amino acid analysis and HPLC assay in an inter-laboratory study.
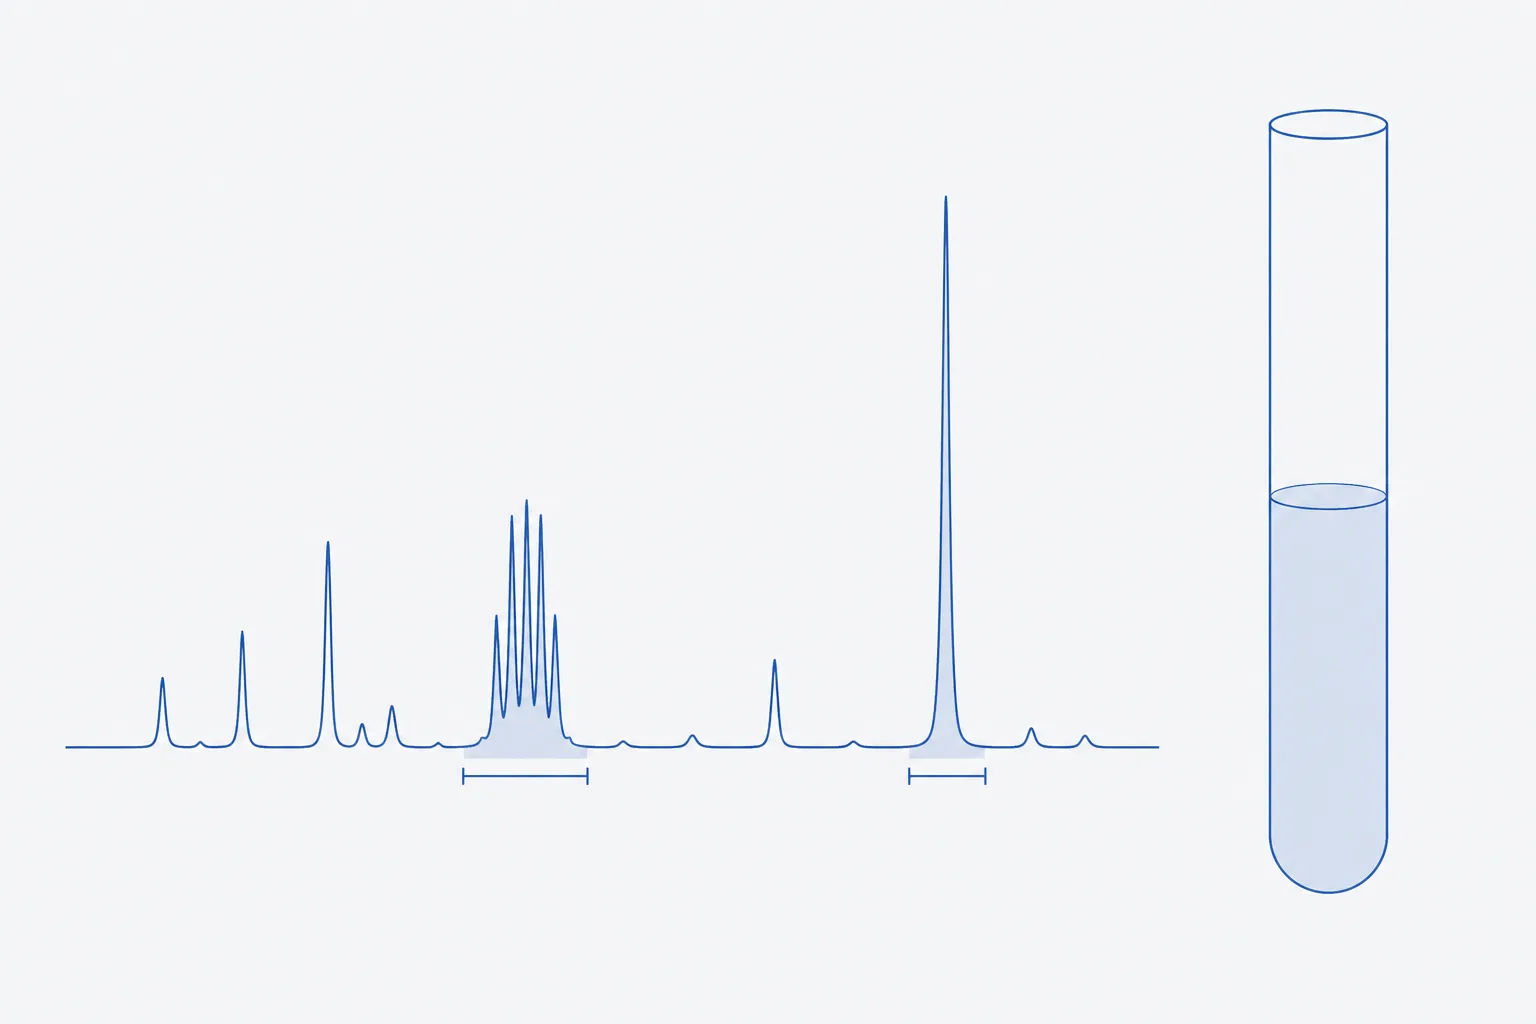
Quantitative proton NMR (qNMR) assigns peptide content by weighing the peptide and a certified internal standard into one solution, recording a spectrum under conditions in which every signal is fully relaxed, and converting the ratio of two integrated signals into a mass fraction. The signal area is proportional to the number of nuclei that produce it, whatever the molecule, so no peptide reference material is needed 24. The result is the content of the peptide in the weighed solid, the same quantity that amino acid analysis reports, and the sample can be recovered afterwards.
This page gives the equation, the choice of standard, the acquisition settings that decide accuracy, a worked calculation on an invented decapeptide, AGSPLKEVFR, and the comparison with amino acid analysis and HPLC assay drawn from an inter-laboratory study on a single peptide. The worked figures are illustrative arithmetic and describe no real material.
What qNMR measures and why it is a primary ratio method
In a proton spectrum recorded with full relaxation, the integral of a signal is proportional to the number of protons giving rise to it. Compare two signals in one tube, one from the analyte and one from a standard of known purity and mass, and the unknown amount of analyte follows from arithmetic. There is no calibration curve and no response factor, which is why the method is called a primary ratio method: it is traceable through the masses weighed and the certified purity of the standard 24.
Medicinal-chemistry journals have argued that a quantitative proton assay should accompany purity claims, because chromatographic purity and content are different quantities and a clean chromatogram says nothing about water, salts or solvent 2. For peptides, where the weighed solid is often 70 to 85% peptide, the argument is direct. The companion references on this site distinguish assay, purity and content, and describe amino acid analysis as the hydrolysis-based reference.
Choosing an internal standard: purity, solubility, resolved signals
| Requirement | Why | Example: maleic acid in D2O |
|---|---|---|
| Certified purity, traceable | The assigned content inherits the standard's purity | Obtain as a certified reference material with a stated purity and uncertainty |
| Stable, non-volatile, non-hygroscopic | It is weighed in milligrams; water uptake changes the mass | Stable solid; weigh promptly and store dry |
| Soluble in the same solvent as the analyte | Both must be in one homogeneous solution | Soluble in D2O |
| Few, simple signals, preferably one singlet | Minimises overlap and integration error | One singlet from two equivalent olefinic protons, near 6 ppm |
| Signal in a clear spectral region | Must not overlap analyte, solvent or impurity signals | Region near 6 ppm is empty for many peptides |
| Does not react with or perturb the analyte | Chemical shifts and stability must be unchanged | Acidic; it changes the pH of an unbuffered solution, so check the peptide signals |
| T1 comparable to the analyte's | A very long T1 forces a long relaxation delay | Measure T1 for the conditions used |
In the oxytocin study most laboratories used caffeine as the standard, with maleic acid and a trimethylsilyl propionate salt used by some; one laboratory obtained better repeatability with maleic acid than with caffeine (0.7% against 2.1% relative standard deviation) 1. The authors noted that the caffeine purine proton near 7.9 ppm may depend on solvent and concentration, and that peptide signals often crowd the region between 2 and 4 ppm 1. Standard selection is a property of the pair, analyte and standard, and has to be re-examined for each sequence.
Acquisition parameters: relaxation delay, pulse angle, scans, temperature
Quantitative accuracy is decided at the spectrometer. The settings below follow the validation literature on the method and the proposed revision of the pharmacopoeial NMR chapter, which expands its treatment of sample preparation, reference material selection, acquisition parameters and data analysis 345.
| Parameter | Setting | Reason |
|---|---|---|
| Relaxation delay, D1 (plus acquisition time) | At least 5 × the longest T1 of any quantified signal; 7 × for tighter work | After a 90° pulse, a delay of 5 × T1 recovers 99.3% of the magnetisation, 7 × T1 recovers 99.9% |
| Pulse angle | 90° with full relaxation; a smaller angle permits a shorter delay but must be validated | A calibrated, uniform excitation over all quantified signals |
| Number of scans | Enough for the target signal-to-noise on the smaller of the two integrals | A commonly cited target is of the order of 250:1 for about 1% integration uncertainty; confirm in validation |
| Temperature | Controlled and stable, recorded | Chemical shifts and exchange rates move with temperature |
| Spectral width and digital resolution | Wide enough for flat baselines on both sides of each signal; enough points across the line | Baseline distortion is a direct integration error |
| Sample spinning | Off, if the instrument permits | Avoids spinning sidebands under quantified signals |
The longest T1 is rarely the one in the integrated region. Measure it, with an inversion-recovery experiment, on the actual solution; small molecules such as the standard often relax more slowly than the peptide, so the standard sets the delay. A delay chosen from a table of typical values is a source of unexplained bias.
Integrate over the same width for both signals, wide enough to capture the tails of the lines. A Lorentzian line holds about 98.4% of its area within ±20 line widths and 99.5% within ±64. Natural carbon-13 puts about 1.1% of a proton signal's intensity into satellites; include the satellites for both signals or for neither, consistently.
Why peptides are harder: line broadening, exchangeable protons, crowded spectra
- Exchangeable protons. Amide, amine, hydroxyl and guanidinium protons exchange with deuterium in D2O and either vanish or vary with pH and temperature. Never quantify on them. Use non-exchangeable protons: aromatic ring protons, methyl groups, alpha protons if resolved.
- Crowding. A peptide of ten residues produces overlapping multiplets between roughly 1 and 4.5 ppm. Aromatic ring protons of phenylalanine, tyrosine and tryptophan, and histidine ring protons, sit in clearer regions and are the usual quantification targets.
- Line broadening. Aggregation, intermediate exchange between conformers and a viscous solution broaden lines and lower the peak height, and a broad base is hard to integrate. Dilute, raise the temperature, or change solvent and re-examine.
- Water signal. The residual water line in D2O can overlap alpha-proton signals; solvent suppression distorts nearby integrals and is avoided for quantified signals.
- Counter-ions. Acetate gives a methyl singlet near 1.9 ppm that can be integrated against the same standard, so the same spectrum can report acetate content. Trifluoroacetate has no proton signal and needs a fluorine experiment.
The content equation and a worked example
Content of analyte x in the weighed solid, using internal standard std:
P(x) = [I(x) ÷ I(std)] × [N(std) ÷ N(x)] × [M(x) ÷ M(std)] × [m(std) ÷ m(x)] × P(std)
where I is the integrated area, N the number of protons in the integrated signal, M the molar mass, m the weighed mass and P the purity as a mass fraction. The result is the content of the species whose molar mass M(x) was entered, so decide at the outset whether that is the free peptide or the salt; the free-peptide convention reports the peptide fraction of the weighed solid.
| Quantity | Analyte (phenylalanine ring) | Standard (maleic acid) |
|---|---|---|
| Signal | Ring protons, near 7.3 ppm | Olefinic singlet, near 6 ppm |
| Protons in signal, N | 5 | 2 |
| Molar mass, M, g·mol⁻¹ | 1,103.29 | 116.07 |
| Weighed mass, m, mg | 10.12 | 2.53 |
| Purity of standard, P | to be found | 0.9994 |
| Integrated area ratio, I(x) ÷ I(std) | 0.821 |
- Proton-count ratio: N(std) ÷ N(x) = 2 ÷ 5 = 0.400.
- Molar-mass ratio: M(x) ÷ M(std) = 1,103.29 ÷ 116.07 = 9.506.
- Mass ratio: m(std) ÷ m(x) = 2.53 ÷ 10.12 = 0.2500.
- Multiply: 0.821 × 0.400 × 9.506 × 0.2500 × 0.9994 = 0.780.
- Content of the peptide in the weighed solid: 78.0%.
- Check by amounts: the standard is 21.78 µmol (2.53 mg × 0.9994 ÷ 116.07); the peptide is 7.15 µmol (10.12 mg × 0.780 ÷ 1,103.29), which fits the integral ratio of 0.821 × 2 ÷ 5 = 0.328 against 7.15 ÷ 21.78 = 0.328.
The weighings dominate the uncertainty budget alongside the integration. A 2.53 mg standard on a balance with 0.01 mg readability carries a rounding uncertainty near 0.4%, which is why microbalance weighing, a qualified balance and minimal handling of hygroscopic solids are part of the method and not preparation detail. Every material weighed to milligrams is also a water-uptake risk.
qNMR against amino acid analysis and HPLC assay: the oxytocin comparison
An inter-laboratory study sent the same oxytocin vials to 14 laboratories in 10 countries and compared three ways of assigning content: an HPLC assay against a bulk reference material whose purity was set by mass balance, qNMR (six laboratories, mostly with caffeine as the standard), and amino acid analysis by several routes (five laboratories, four valid results) 1. The mean contents were close; the spread was not equal.
| Method | Mean | Between-laboratory RSD | Within-laboratory RSD |
|---|---|---|---|
| HPLC assay | 1.807 | 2.3% | 0.7% |
| qNMR | 1.798 | 4.73% | 1.85% |
| Amino acid analysis | 1.733 | 5.44% | 1.78% |
The authors attributed the HPLC method's low variability to the common reference material, and the caution to attach is the reference itself: its purity came from mass balance, including water by Karl Fischer titration and acetic acid content of about 7.5 to 8.0% w/w, so the HPLC route inherits those determinations 1. The amino acid analysis mean rested on four laboratories, too few for firm conclusions 1.
| Feature | qNMR | Amino acid analysis | HPLC assay |
|---|---|---|---|
| Sample consumed | Not destroyed; recoverable, but several milligrams are needed | Destroyed by hydrolysis; micrograms | Destroyed in a small aliquot; micrograms |
| Needs a peptide reference standard | No; needs a certified internal standard | No; needs amino acid standards | Yes, with an assigned content |
| Traceability | To the certified standard and to mass | To amino acid standards, with hydrolysis losses corrected | To the reference standard and its assigned value |
| Counts | Molecules carrying the integrated proton | All peptide-bound amino acids, including impurities | The peak against the standard's peak |
| Weak points | Overlap, broad lines, relaxation delay, weighing | Residues lost in hydrolysis, long turnaround | Depends on the standard's value |
| Best when | No reference standard exists, or one must be assigned | An independent check of content from composition | A qualified standard exists and routine assay is needed |
Validation elements per ICH Q2(R2)
ICH Q2(R2) lists the characteristics to demonstrate for an assay procedure: specificity, range, accuracy and precision among them 6. The mapping to qNMR follows from the parameters above, and an earlier validation study set out the same elements for the technique 3.
| Characteristic | How it is demonstrated |
|---|---|
| Specificity | No overlap under either integrated signal, shown by spectra of analyte alone, standard alone and the mixture; confirmation in a second solvent or with a second signal pair |
| Accuracy | Agreement with an independent route, such as a material of known content or amino acid analysis |
| Repeatability | Replicate preparations, each weighed separately, by one analyst on one spectrometer |
| Intermediate precision | Different days, analysts and, where possible, spectrometers |
| Range and linearity | Signal ratio against mass ratio over the content range, with the intercept near zero |
| Robustness | Relaxation delay, temperature, pH and integration width varied deliberately |
Reporting and the record set
Report the content with its basis and its uncertainty, and name the quantified signals. The record needs enough that another analyst could recompute the number from the raw data.
- Identity of analyte and standard; lot of the certified standard with certificate and purity
- Balance identifier and calibration status; both masses with their uncertainties
- Solvent, volume, pH or buffer, temperature
- Spectrometer, field, probe, software version; pulse calibration; measured T1 and the delay chosen
- Raw data (free induction decays), processing parameters, phasing and baseline correction method
- Integration regions for each signal, with the proton counts used
- The calculation, with each term and the molar mass convention (free peptide or salt)
- Replicates, standard deviation and the stated uncertainty
Acquisition-and-calculation procedure
- Choose analyte and standard signals that are resolved and non-exchangeable; confirm with spectra of each alone.
- Weigh the peptide and the certified standard on a qualified microbalance into the same vial; record both masses.
- Dissolve completely in the deuterated solvent, transfer to the tube, and record volume and temperature.
- Tune, match and shim to a narrow, symmetric line.
- Calibrate the 90° pulse; measure T1 of every quantified signal by inversion recovery.
- Set D1 plus acquisition time to at least five times the longest T1; set the scans for the target signal-to-noise.
- Acquire; process with careful phasing and a flat baseline; apply identical integration widths to both signals.
- Calculate P(x) from the equation; repeat on independent preparations.
- Report the content with its uncertainty and file the record set.
References
- Survey of peptide quantification methods and comparison of their reproducibility: a case study using oxytocin
- Importance of purity evaluation and the potential of quantitative 1H NMR as a purity assay
- Validation of quantitative NMR
- Quantitative 1H NMR spectroscopy
- <761> Nuclear Magnetic Resonance Spectroscopy (proposed revision, Pharmacopeial Forum)
- ICH Q2(R2) Validation of analytical procedures — Scientific guideline