A205 and A214: Quantifying Peptides With No Trp or Tyr
When the sequence has no tryptophan or tyrosine, A280 returns nothing. The far-UV alternative reads the peptide bond itself. Coefficients at 205 and 214 nm, a worked calculation for a generic decapeptide, and the buffer, counter-ion and stray-light constraints that make this harder than A280.
A peptide with no tryptophan or tyrosine is measured by UV absorbance at 205 nm or 214 nm, where the peptide bond itself absorbs, using either a generic mass absorptivity of about 31 mL·mg⁻¹·cm⁻¹ or, better, a molar extinction coefficient built from the sequence: a per-bond term plus a contribution for each absorbing residue 12. At 205 nm the sequence-based coefficient uses 2,780 M⁻¹·cm⁻¹ per peptide bond; at 214 nm the corresponding value is 923 M⁻¹·cm⁻¹ 12. Both methods demand more care than A280, because buffers, counter-ions and stray light all interfere in the far UV.
The A280 reference on this site covers the aromatic case and ends where this page begins: a sequence carrying no tryptophan, tyrosine or cystine gives no usable signal at 280 nm. This page covers the replacement, the residue table, a worked calculation on an invented decapeptide, AGSPLKEVFR, and the cross-check against gravimetric net content. All figures are illustrative arithmetic, not a method for a real material.
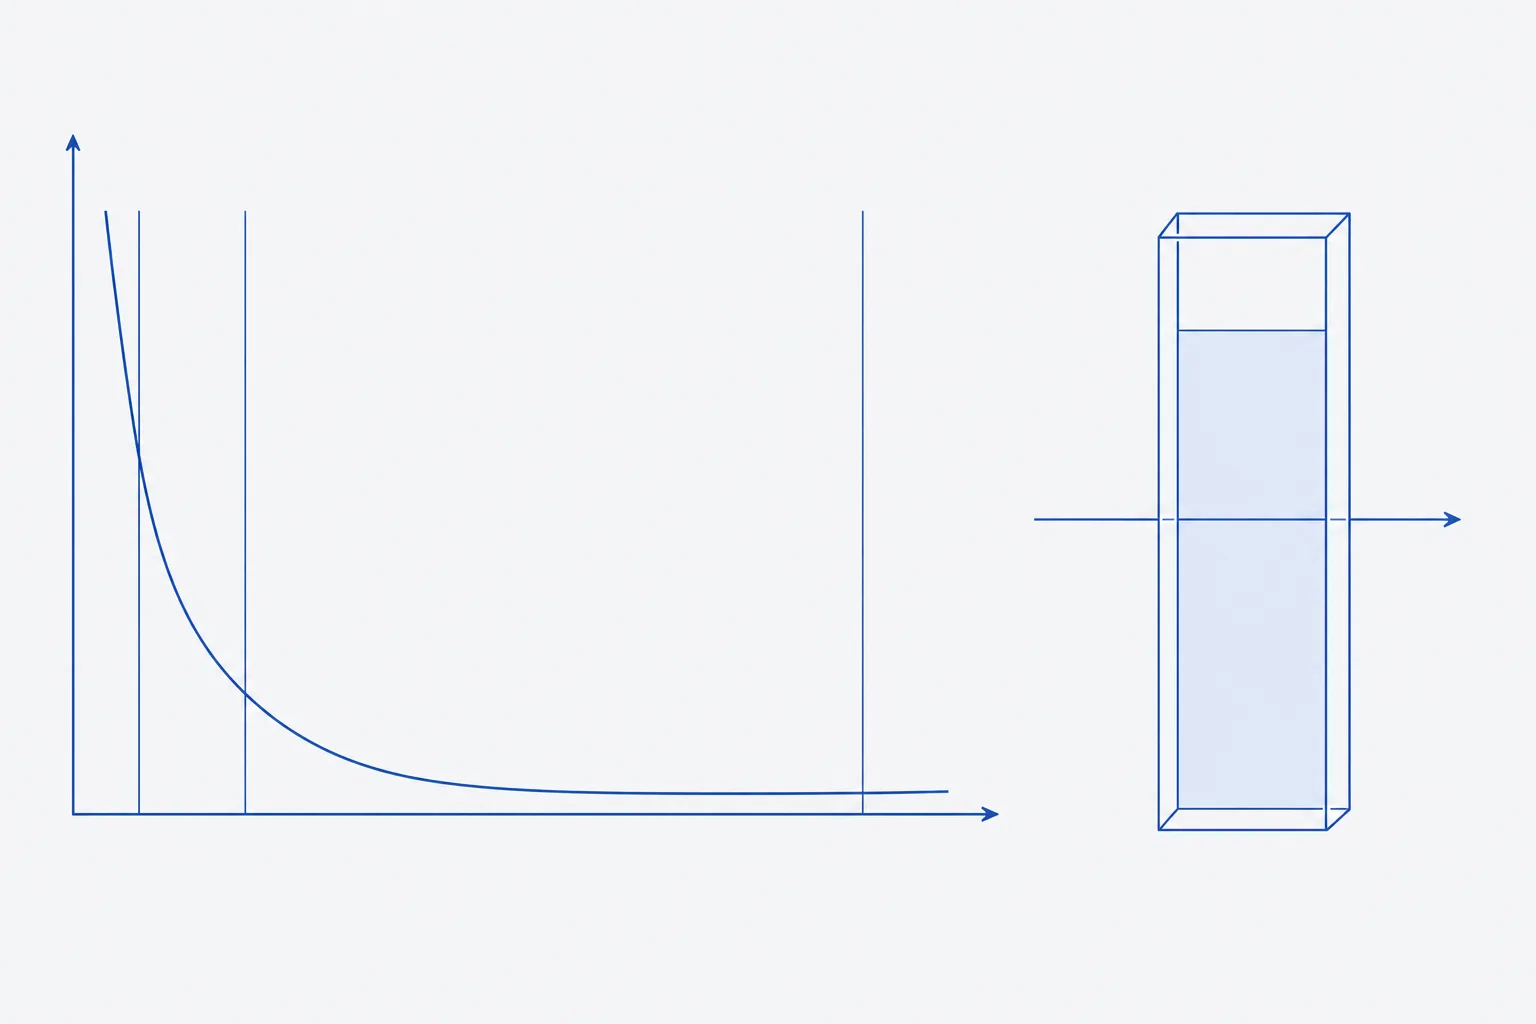
Why A280 fails for peptides lacking Trp and Tyr
At 280 nm only tryptophan, tyrosine and disulfide-bonded cystine absorb usefully. Phenylalanine is nearly transparent. A sequence such as AGSPLKEVFR gives an A280 reading that is indistinguishable from the blank, and a calculated extinction coefficient of zero cannot be inverted into a concentration. The fix is to move to the region where something else in the molecule absorbs.
What absorbs at 205 nm and 214 nm
The peptide bond has a strong electronic transition in the far UV. Measured values depend on wavelength and on how the value is defined, and the two sources below differ in method. A sequence-specific study at 205 nm fitted the bond contribution across eight polypeptides and obtained 2,780 ± 168 M⁻¹·cm⁻¹ per bond 1. A study at 214 nm measured 20 amino acids and the peptide bond in acetonitrile and formic acid, the solvent conditions of reversed-phase HPLC with UV and mass-spectrometric detection, and reported 923 M⁻¹·cm⁻¹ for the bond 2. The wavelengths, solvents and definitions differ, so the two sets of coefficients are not interchangeable.
| Contribution | At 205 nm | At 214 nm (approximate) |
|---|---|---|
| Peptide bond, per bond | 2,780 | 923 |
| Tryptophan | 20,400 | about 30 × bond, near 28,000 |
| Phenylalanine | 8,600 | about 6 × bond, near 5,500 |
| Tyrosine | 6,080 | about 6 × bond, near 5,500 |
| Histidine | 5,200 | about 6 × bond, near 5,500 |
| Methionine | 1,830 | similar to the bond, near 900 |
| Arginine | 1,350 | much lower than the bond |
| Cysteine | 690 | much lower than the bond |
| Asparagine, glutamine | 400 each | much lower than the bond |
| Cystine (disulfide pair) | 2,200 (820 more than two cysteines) | not tabulated here |
| Proline, inside the chain | not in the 205 nm table | about 3 × bond, near 2,800 |
Read the table for what it implies. At both wavelengths the bond count dominates for a peptide with few aromatic residues, so the coefficient scales with chain length. At 214 nm proline matters because its amide is tertiary, and an N-terminal proline does not behave like an internal one 2. Residues absent from a column contribute only through the bonds they form in that treatment.
The generic coefficient and its limits
Scopes' 1974 method proposed measuring protein at 205 nm with a correction for aromatic content based on the ratio of the A280 and A205 readings, giving concentration in mg·mL⁻¹ as A205 divided by (27.0 + 120 × A280/A205) 3. For a sequence with no A280 signal the second term vanishes and the divisor is 27.0. A fixed absorptivity of 31 mL·mg⁻¹·cm⁻¹ is also in common use as the generic value for the backbone. In a later comparison across polypeptides of known sequence, a non-sequence-specific estimate carried errors up to 19.0%, and the ratio formula lowered the maximum error to 14.2% 1.
Both shortcuts were derived for typical proteins, where the mix of residues averages out. A short peptide has no averaging to do. If it happens to be rich in phenylalanine or histidine, a generic coefficient reads high in absorptivity and returns too low a concentration, and the reverse for a glycine- and alanine-rich sequence. The sequence-based approach removes that bias.
Worked calculation for a generic decapeptide
The peptide is AGSPLKEVFR: ten residues, nine peptide bonds, linear with free termini, molar mass 1,103.29 g·mol⁻¹. The sample is 2.00 mg of gross solid dissolved in 1.000 mL of water and diluted 1:100 in water for measurement. A 1 cm quartz cuvette is read at 205 nm against water prepared identically; the blank-subtracted absorbance is 0.493. The sequence contains one phenylalanine and one arginine among the residues with tabulated 205 nm terms. All values are invented for illustration.
- Count the peptide bonds: 10 residues give 9 bonds. Contribution: 9 × 2,780 = 25,020 M⁻¹·cm⁻¹.
- Add the tabulated side-chain terms: phenylalanine 8,600; arginine 1,350. Residues without a tabulated term add nothing beyond their bonds.
- Sum: ε205 = 25,020 + 8,600 + 1,350 = 34,970 M⁻¹·cm⁻¹. Divided by the molar mass this is a mass absorptivity of 31.70 mL·mg⁻¹·cm⁻¹.
- Invert Beer-Lambert: c = A ÷ (ε × l) = 0.493 ÷ (34,970 × 1) = 1.410 × 10⁻⁵ mol·L⁻¹, or 14.10 µmol·L⁻¹.
- Convert to mass concentration: 14.10 µmol·L⁻¹ × 1,103.29 g·mol⁻¹ = 15.55 µg·mL⁻¹ in the measured solution.
- Correct for dilution: the stock is 1,555 µg·mL⁻¹, which is 1.555 mg·mL⁻¹ of peptide.
- Compare with the weighed mass: 1.555 ÷ 2.00 = 77.8% peptide content of the gross solid.
| Coefficient used | Value | Concentration, µg·mL⁻¹ (measured solution) | Net content of gross solid |
|---|---|---|---|
| Sequence-based ε205 | 34,970 M⁻¹·cm⁻¹ (31.70 mL·mg⁻¹·cm⁻¹) | 15.55 | 77.8% |
| Generic absorptivity | 31 mL·mg⁻¹·cm⁻¹ | 15.90 | 79.5% |
| Scopes ratio formula with A280 = 0 | 27.0 mL·mg⁻¹·cm⁻¹ in effect | 18.26 | 91.3% |
For this sequence the generic value happens to land within about 2% of the sequence-based one, because the aromatic and arginine contributions add roughly what a typical protein contributes per residue. The ratio formula, which assumes a typical protein's balance of A280 against A205, reads 13.5 percentage points higher. The agreement of the first two is luck and the discrepancy of the third is structural; neither can be known without computing the sequence-based figure.
The 214 nm route for the same peptide
At 214 nm the bond term is 9 × 923 = 8,307. Taking phenylalanine at about six times the bond value (5,538) and the internal proline at about three times (2,769) gives roughly 16,600 M⁻¹·cm⁻¹ before counting any remaining residues, whose contributions are smaller than a bond's. At the concentration of 14.10 µmol·L⁻¹ above this predicts an absorbance of about 0.23 at 214 nm. It is a lower-bound estimate because the small contributions of other residues are omitted, and it is useful as a consistency check: a measured A214 far from the estimate, in a sample whose A205 gave 14.10 µmol·L⁻¹, points to interference at one wavelength.
Buffer absorbance, counter-ions, stray light and pathlength
| Source | Effect | Control |
|---|---|---|
| Buffer salts and additives | Many absorb strongly at 205 nm | Dilute the sample in water, or in a buffer measured separately at the same dilution, and subtract; the sample must absorb well above the buffer |
| Counter-ion in the solid (for example trifluoroacetate or acetate) | Adds absorbance; part of the weighed solid, so not removed by a buffer blank | Treat the reading as an upper bound for the peptide, or use a method blind to the counter-ion; see the counter-ion reference |
| Stray light | Flattens high absorbances; worst where the lamp is weak | Confirm stray light at 200 nm is within the qualification limit |
| Cuvette material | Plastic and ordinary glass absorb in the far UV | Use quartz or fused silica, matched, with a stated 1 cm path |
| Wavelength error | The absorbance rises steeply toward shorter wavelengths, so a small offset gives a large error | Qualify wavelength accuracy at or near the working wavelength |
| Dissolved oxygen, solvent impurities | Raise the baseline | Use fresh water of suitable grade and the same lot for blank and sample |
In the 205 nm study the authors worked in 1 cm quartz cuvettes, diluted samples in water, measured the buffer alone at the same dilutions, and subtracted it, requiring the difference to be significantly larger than the experimental error and averaging only points within the linear range of absorbance against concentration 1. Follow the same discipline. Stray light is checked with a cut-off solution matched to the region, potassium chloride at 12 g·L⁻¹ for 190 to 205 nm 4. A dilution series with a linear relationship is a better test of the reading than a single point.
Cross-checking against amino acid analysis and net content
The optical result is a content estimate, 77.8% in the example. Compare it with an independent route: amino acid analysis after hydrolysis, or the net peptide content assigned by mass balance from water and counter-ion determinations. Set the agreement criterion before comparing. With the coefficient's own uncertainty, the comparison has a natural scale: the ±168 on the bond term, if it applies to all nine bonds in the same direction, shifts ε205 by 1,512 M⁻¹·cm⁻¹, or 4.3%, which moves the 77.8% by about three percentage points either way. An amino acid analysis figure of 76.4% (an invented value) would sit inside that and support the optical result; one of 70% would not, and would send the investigation to the blank, the counter-ion and the weighing.
Reporting the result with its uncertainty
A concentration from far-UV absorbance is reported with the wavelength, the coefficient and its source, the pathlength, the blank, the dilution and the instrument qualification status. State that the coefficient is calculated, not measured on this peptide. Include the uncertainty from the coefficient and note which interferences were controlled. In the 205 nm study, sequence-based concentrations differed from A280-derived ones by at most 8.2% and mostly by under 4% 1; that is a realistic scale for the coefficient alone, before the contribution of dilution and weighing.
Procedure
- Confirm that the sequence has no Trp, Tyr or disulfide, so that A280 is unusable; record the sequence and molar mass.
- Choose the wavelength: 205 nm for the sequence-based method with tabulated terms, 214 nm where the method matches HPLC detection.
- Calculate ε from the bond count and the residue terms; record the source of each value.
- Confirm instrument wavelength accuracy and stray light for the working wavelength.
- Prepare the sample in water or a low-absorbance buffer; prepare the blank identically, including the same lot of diluent.
- Measure a dilution series in a matched quartz cuvette; use only readings in the instrument's linear range.
- Subtract the blank; compute c = A ÷ (ε × l) at each dilution and compare them.
- Convert to mass concentration and to content of the weighed solid.
- Cross-check against amino acid analysis or net content, and report with the coefficient's uncertainty.
References
- Sequence-specific determination of protein and peptide concentrations by absorbance at 205 nm
- Prediction of molar extinction coefficients of proteins and peptides using UV absorption of the constituent amino acids at 214 nm to enable quantitative reverse phase high-performance liquid chromatography-mass spectrometry analysis
- Measurement of protein by spectrophotometry at 205 nm
- General Chapter <857> Ultraviolet-Visible Spectroscopy (USP 38-NF 33 S2 text, mirror)