Relative Response Factors: Why Area % Is Not Weight %
The correction behind an HPLC purity figure: response factor and relative response factor defined, RRF determination by impurity standard or slope ratio, the 1 ÷ RRF correction applied to a worked four-impurity chromatogram, the 0.8 to 1.2 window in which correction is commonly waived, and the ICH Q3A thresholds the corrected values are judged against.
A relative response factor (RRF) is the detector response per unit amount of an impurity divided by the response per unit amount of the main component under the same conditions, and it changes an area-percent purity figure by converting each impurity area into a mass-equivalent area: corrected area = area ÷ RRF, or equivalently area × correction factor where the correction factor is 1 ÷ RRF. Area-percent purity assumes every peak has an RRF of exactly 1 and is therefore a statement about absorbance, not mass. Where an impurity absorbs less than the parent at the detection wavelength, area percent understates it; where it absorbs more, area percent overstates it. ICH Q3A(R2) allows the drug substance to serve as the standard for its impurities only where the response factors are close, or a correction factor is applied, or the impurities are in fact being overestimated 1.
Companion references explain what an area-percent figure measures and how purity, content and assay differ. This page covers the correction arithmetic. The worked example is an invented chromatogram at 214 nm: a main peak and four impurities with assumed response factors. It describes no real material or method.
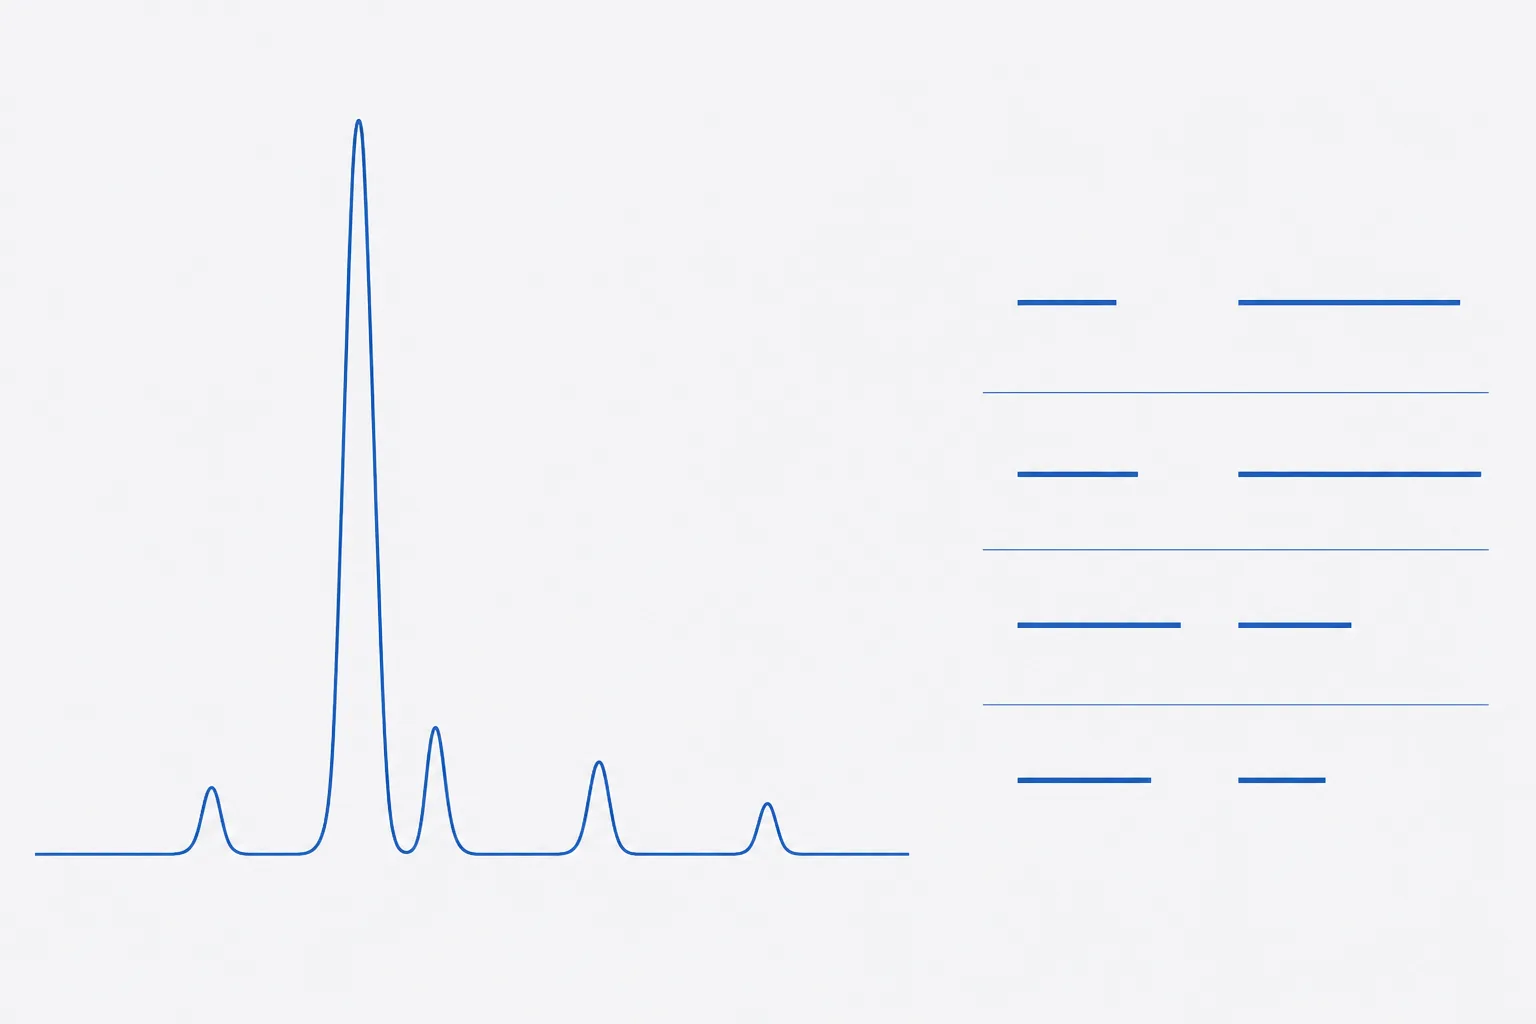
Response factor and relative response factor defined
A response factor is the slope of detector response against amount injected, in area units per microgram or per nanomole. A relative response factor divides an impurity's response factor by the parent's, measured under the same method, wavelength and bandwidth. An RRF below 1 means the impurity gives less signal per unit amount than the parent; above 1, more. The basis must be stated: an RRF per unit mass and an RRF per mole differ by the ratio of molar masses, RRF(mass) = RRF(molar) × M(parent) ÷ M(impurity). Purity work is normally on a mass basis, because the specification is in per cent by weight.
| Term | Definition | Formula |
|---|---|---|
| Response factor, RF | Detector response per unit amount | RF = area ÷ amount |
| Relative response factor, RRF | Impurity RF relative to parent RF | RRF = RF(impurity) ÷ RF(parent) |
| Correction factor, CF | Multiplier that converts impurity area to parent-equivalent area | CF = 1 ÷ RRF |
| Uncorrected area % | Share of total integrated area | A(i) ÷ ΣA × 100 |
| Corrected area % | Share of total after each area is divided by its RRF | (A(i) ÷ RRF(i)) ÷ Σ(A(j) ÷ RRF(j)) × 100 |
Why area % assumes equal absorptivity at the detection wavelength
Under Beer–Lambert, a peak's area is proportional to the molar absorptivity of the species at the detection wavelength multiplied by the amount passing the detector. Dividing one area by the sum of all areas therefore gives a share of total absorbance. It equals a share of total mass only if every species has the same absorptivity per unit mass, which is the RRF = 1 assumption. ICH Q3A(R2) names this directly: acceptance criteria and analytical procedures for impurities may rest on analytical assumptions such as equivalent detector response, and those assumptions are to be stated and discussed 1.
The assumption fails in both directions. A species with a weaker chromophore is under-counted and may be reported below a threshold it actually exceeds. A species with a stronger chromophore is over-counted, which is conservative for the impurity but makes the main-peak purity read lower than the true mass fraction. Neither error is visible on the chromatogram.
Determining RRF: impurity standards, slope ratios, wavelength choice
The reference route uses a characterised standard of the impurity with an assigned content. Where no standard exists, Nussbaum and colleagues showed that coupling a chemiluminescent nitrogen-specific detector to the UV detector gives relative UV response factors on-line, without isolating the impurity, provided its molecular formula is known, for example from accurate-mass LC-MS 4. Both routes yield a number that belongs to one wavelength and bandwidth; a change of either requires re-determination.
- Obtain or prepare an impurity reference standard, characterise it and assign its content. Record the assigned value and its basis.
- Prepare at least five levels of the impurity and of the parent across the range the impurity is expected to occupy, from the quantitation limit to about 150 % of its specification, in the method diluent.
- Inject in randomised order under the purity method's exact conditions: column, gradient, flow, wavelength, bandwidth and reference wavelength.
- Fit a calibration line to each series. RRF on a mass basis = slope of the impurity line ÷ slope of the parent line, both in area units per µg·mL⁻¹. Check that both intercepts are consistent with zero.
- Where only one level is practical, use RRF = (A(impurity) ÷ c(impurity)) ÷ (A(parent) ÷ c(parent)) from replicate injections, and record the level used.
- Record the RRF with the wavelength, bandwidth, column lot, standard identity and date. Round only on the report.
- Re-determine when the detection wavelength, detector type or impurity standard changes; verify periodically against system-suitability data.
Worked slope ratio for two of the impurities below: parent slope 2,050 area units per µg·mL⁻¹; impurity C slope 1,128, so RRF = 1,128 ÷ 2,050 = 0.550; impurity D slope 3,280, so RRF = 3,280 ÷ 2,050 = 1.600. Wavelength choice matters at the method-development stage: if several wavelengths give acceptable resolution, the one at which the RRFs cluster nearest to 1 minimises the correction and its uncertainty.
Applying the correction: worked chromatogram table
An invented chromatogram at 214 nm. Areas are in arbitrary units; the impurity identities are generic types chosen to illustrate response differences, and the RRFs are assumed values of the kind the determination above would produce.
| Peak | Area | Uncorrected area % | RRF | Corrected area (A ÷ RRF) | Corrected % |
|---|---|---|---|---|---|
| Main component | 985,400 | 98.47 | 1.00 | 985,400 | 98.28 |
| Impurity A: single-residue deletion (des-Gly) | 6,120 | 0.61 | 0.92 | 6,652 | 0.66 |
| Impurity B: methionine sulfoxide | 4,350 | 0.43 | 1.08 | 4,028 | 0.40 |
| Impurity C: truncated fragment lacking the aromatic residues | 2,970 | 0.30 | 0.55 | 5,400 | 0.54 |
| Impurity D: adduct carrying an aromatic protecting group | 1,860 | 0.19 | 1.60 | 1,163 | 0.12 |
| Total | 1,000,700 | 100.00 | 1,002,642 | 100.00 |
Impurity C nearly doubles on correction, from 0.30 % to 0.54 %, because a fragment that has lost the sequence's tryptophan and tyrosine absorbs far less per unit mass. Impurity D falls from 0.19 % to 0.12 %, because the aromatic protecting group adds a chromophore the parent does not have. The main-peak figure moves from 98.47 % to 98.28 %. None of these changes is large in absolute terms. Two of them cross a threshold.
The 0.8 to 1.2 window and when correction is required
The European Pharmacopoeia convention, as the EDQM's own guidance on related-substances tests explains, is that where a monograph states no correction factor for an impurity, its response factor is taken to lie between 0.8 and 1.2 and the impurity is compared against a dilution of the test solution; an impurity whose response factor falls outside that range either has a correction factor stated in the monograph or is quantified against its own reference standard 3. The window is a pragmatic tolerance of about ±20 % on a number that is itself uncertain, not a finding that correction is scientifically unnecessary inside it.
| Convention | Impurity A | Impurity B | Impurity C | Impurity D | Total impurities |
|---|---|---|---|---|---|
| Uncorrected (all RRF taken as 1) | 0.61 | 0.43 | 0.30 | 0.19 | 1.53 |
| All four corrected | 0.66 | 0.40 | 0.54 | 0.12 | 1.72 |
| Window applied (A and B uncorrected, C and D corrected) | 0.61 | 0.43 | 0.54 | 0.12 | 1.70 |
ICH Q3A(R2) adds a sequencing rule: once an impurity has been identified, if its response factor is found to differ significantly from the parent's, the actual amount present is re-estimated and re-evaluated against the qualification threshold 1. In practice that means an RRF is determined for every specified impurity, and the window is applied only to those for which no standard yet exists.
Reporting, identification and qualification thresholds (ICH Q3A/Q3B)
ICH Q3A(R2) sets three thresholds for impurities in a new drug substance, banded by the registered intake of the substance. For the lower band they are a reporting threshold of 0.05 %, an identification threshold of 0.10 % and a qualification threshold of 0.15 %, each with an absolute-intake alternative whichever is lower; for the higher band they are 0.03 %, 0.05 % and 0.05 % 1. ICH Q3B(R2) sets analogous thresholds for degradation products in a drug product, banded more finely by intake, with a reporting threshold of 0.1 % for the largest band 2. These are regulatory values for registered medicines; a research material has no registered intake, so the Q3A lower-band figures serve as the conventional reference points, and that convention should be stated.
Q3A(R2) also fixes the reporting arithmetic: results below 1.0 % are reported to two decimal places, results at or above 1.0 % to one, rounded by conventional rules, and the quantitation limit of the procedure must be at or below the reporting threshold 1. Against those rules, impurity C in the worked table sits above the qualification threshold whether or not it is corrected, but impurity D changes category: uncorrected it reads 0.19 %, above 0.15 %, and would need qualification; corrected it reads 0.12 %, between the identification and qualification thresholds. The correction is therefore not an academic refinement. It decides what work the result triggers.
Peptide-specific effects: truncations and oxidised species at 214 nm
At 214 nm the peptide bond itself absorbs, at roughly 900 M⁻¹·cm⁻¹ per bond, and the side chains of tryptophan, tyrosine, phenylalanine and histidine add several thousand each; Kuipers and Gruppen showed that the molar extinction coefficient of a peptide at this wavelength can be predicted from its composition on that basis, using absorbances of the constituent amino acids measured in vitro 5. Three consequences follow for the RRFs of common peptide impurities.
First, a deletion or truncation that removes only non-aromatic residues changes the number of bonds and the mass almost in proportion, so its RRF per unit mass stays near 1; impurity A is such a case, and 0.92 is typical. Second, a cleavage that separates the aromatic residues from the rest produces one fragment with a mass RRF well below 1 and another well above it; impurity C is the first kind, and a method that reports it uncorrected will under-count it by almost half. Third, oxidation of methionine to the sulfoxide barely changes the chromophore, so the RRF stays near 1, whereas oxidation of tryptophan to kynurenine or a protecting group left on an aromatic side chain changes it strongly, as impurity D illustrates. At 280 nm all of this is worse: response depends entirely on tryptophan and tyrosine content, and a fragment with neither is invisible, which the companion reference on area-percent purity treats in full.
Stating the basis of a purity figure on a report
| Element | State as |
|---|---|
| Method | Column, gradient, flow, detection wavelength and bandwidth |
| Integration | Disregard limit and any peaks excluded, with the reason |
| Basis of the figure | Area % uncorrected (all RRF taken as 1.00), or area % corrected with the RRFs listed |
| RRF values | Per impurity, with the determination route (standard or slope ratio), wavelength and date |
| Thresholds applied | Reporting threshold used, rounding rule, decimal places |
| Totals | Sum of impurities above the reporting threshold, computed from unrounded values and rounded once |
A line reading purity 98.5 % by HPLC is a claim without a basis. A line reading 98.3 % by area normalisation at 214 nm, corrected with the listed RRFs, total impurities 1.7 %, is a result a second laboratory can reproduce or dispute on its merits. The difference between the two is the subject of this page.
References
- ICH Harmonised Tripartite Guideline Q3A(R2): Impurities in New Drug Substances
- ICH Harmonised Tripartite Guideline Q3B(R2): Impurities in New Drug Products
- How should the test requirements be applied in related substances tests?
- Determination of relative UV response factors for HPLC by use of a chemiluminescent nitrogen-specific detector
- Prediction of molar extinction coefficients of proteins and peptides using UV absorption of the constituent amino acids at 214 nm to enable quantitative reverse phase high-performance liquid chromatography-mass spectrometry analysis