Control Charts in the Lab: Trending SST and QC Results
System suitability says whether one run passed. A control chart says whether the system is changing. Baseline construction, three-sigma limits, the Westgard rule set and where it fits chromatographic data, and a worked retention-time series.
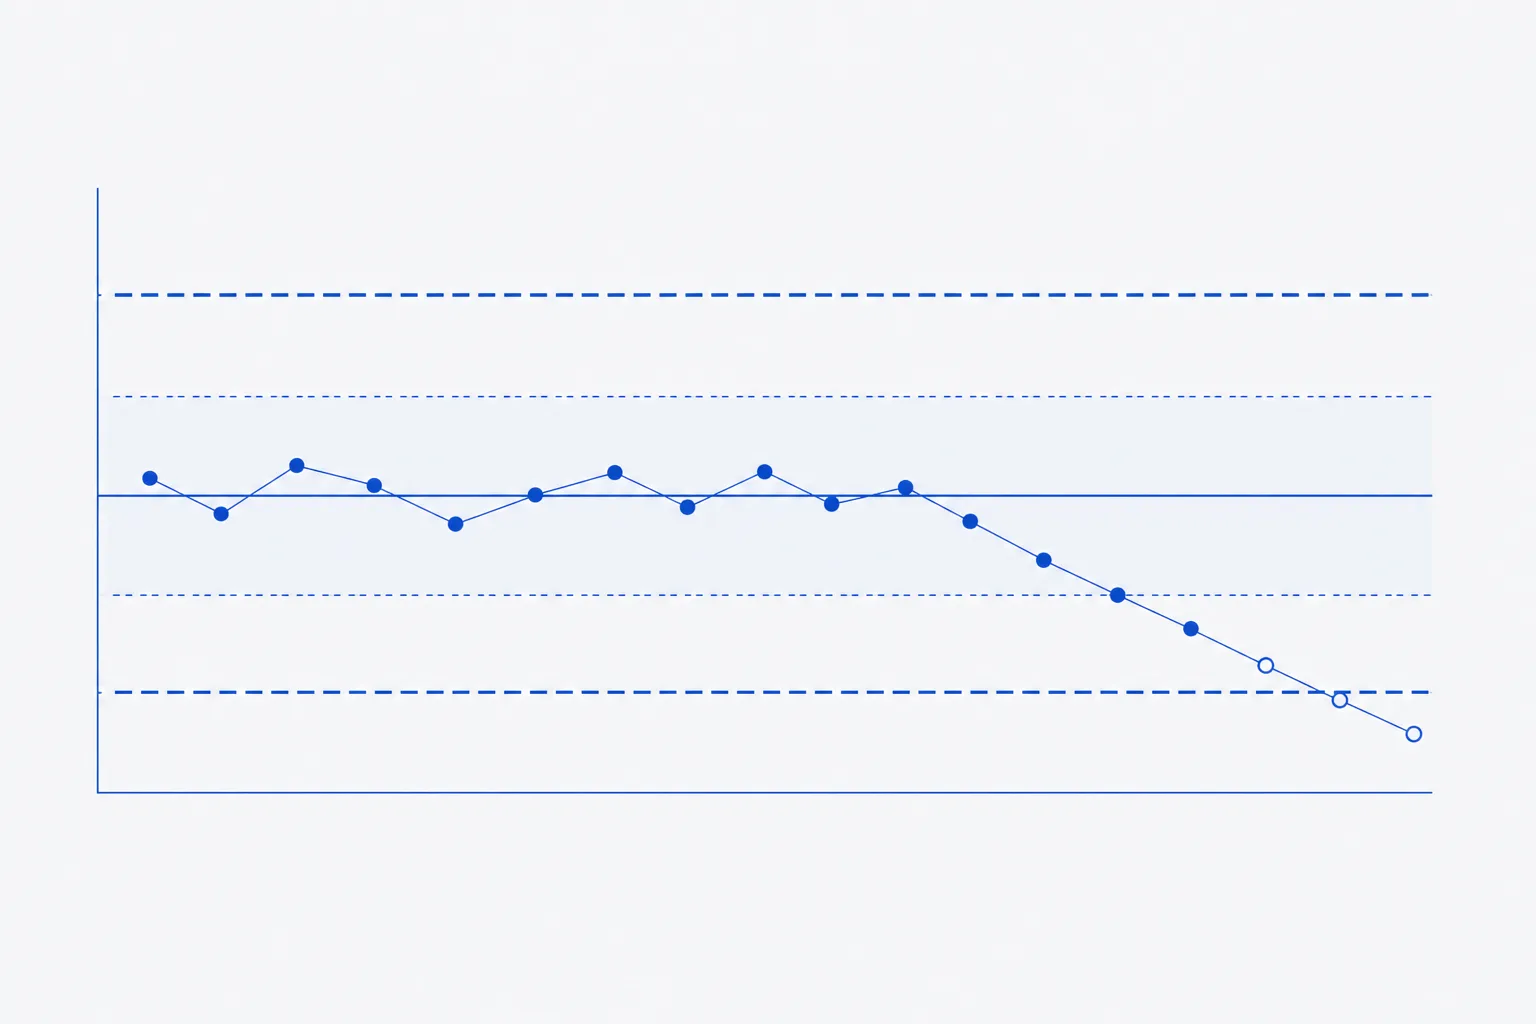
A control chart plots a repeated measurement in run order against limits calculated from the laboratory's own earlier results, so that the limits describe what the system normally does and a departure shows as a point or pattern outside them. For a Shewhart chart the centre line is the mean of a baseline set and the limits are the mean plus and minus three standard deviations 1. A system-suitability test judges one run against fixed criteria; a control chart judges the sequence of runs, and so detects drift and shift that never breach a fixed criterion.
This page is the between-run layer. The per-run pass or fail criteria are on the system-suitability reference, and what to do after a failure is on the out-of-specification reference. Here: building the baseline, the limits, the rule set, which chromatographic parameters earn a chart, and the record. Worked figures use an invented decapeptide method; the retention times describe no real system.
What a control chart adds to a pass/fail SST
A resolution criterion of not less than 2.0 passes at 2.0 and at 8.0 alike. If the critical pair resolved at 3.5 for six months and now returns 2.3, every run still passes and the system has changed. The fixed criterion cannot see it; the chart can. The same holds for a check standard: a recovery of 97% passes a 95 to 105% limit, but if the preceding twenty results averaged 100.2%, the new value is probably not noise.
Keep the fixed criterion as the release gate. The chart is the early warning: a rule violation on a chart is an instruction to investigate while the run still passes.
Building the baseline: n, mean, standard deviation, limits
A chart is only as good as the baseline behind it. Twenty is the working minimum for a stable standard deviation estimate; fewer gives limits that move as results accumulate.
- Decide what is charted: one parameter from one material on one method and instrument, for example retention time of the main peak in the SST injection.
- Collect at least 20 results from runs that were in control: same column type, mobile-phase preparation procedure and instrument, no known faults. Spread them over several days and more than one analyst or preparation, so that the baseline contains the ordinary sources of variation.
- Inspect the 20 before using them. Remove a point only for a documented assignable cause, such as a recorded leak, and say so in the file. Removing points because they are large is how limits become too narrow.
- Calculate the mean and the sample standard deviation (n − 1 in the denominator).
- Draw the centre line at the mean and lines at ±1s, ±2s and ±3s.
- Plot the baseline points themselves to confirm that none fall outside the limits they define. If several do, the baseline was not stable; find out why before charting.
- Fix the rule set in writing, with the response to each violation, before the first new point is plotted.
| Line | Calculation | Retention time, min |
|---|---|---|
| Upper action limit (+3s) | 12.421 + 3 × 0.0396 | 12.540 |
| Upper warning limit (+2s) | 12.421 + 2 × 0.0396 | 12.500 |
| +1s | 12.421 + 0.0396 | 12.461 |
| Centre line | Mean of 20 results | 12.421 |
| −1s | 12.421 − 0.0396 | 12.381 |
| Lower warning limit (−2s) | 12.421 − 2 × 0.0396 | 12.342 |
| Lower action limit (−3s) | 12.421 − 3 × 0.0396 | 12.302 |
The method's fixed retention-time window might be 12.0 to 13.0 minutes. The chart narrows that to 12.30 to 12.54, which is the range in which this system actually runs. A result of 12.35 passes the window and sits in the lower warning zone of the chart.
Shewhart and Levey-Jennings charts
The two names describe the same idea at different dates. Shewhart introduced control charts in industrial production; Levey and Jennings adapted them for the clinical laboratory in 1950, plotting each control result against a mean and standard deviation established from earlier measurements 2. A Levey-Jennings chart is a Shewhart individuals chart with the standard deviation lines drawn at one, two and three units, which is the layout above.
The three-sigma convention is the accepted industry setting. For a stable process with normally distributed results, a point falls outside ±3s on average once in 371 points, which is the false-alarm rate of the plain chart 1. Where the result is a single value per run, the chart is an individuals chart; some texts estimate the standard deviation from the average moving range between successive points divided by 1.128, which is less sensitive to slow drift inside the baseline. The sample standard deviation is simpler and, for a baseline that is stable, equivalent. Standards for charting practice exist at several levels, among them the international standard for Shewhart charts and the clinical-laboratory guideline on statistical quality control principles 56.
Westgard multirules: table and interpretation
Westgard and co-workers combined several decision rules into a multirule procedure in 1981, so that sensitivity to real error rose without the false rejections of a tight single limit 3. The notation is A-L: A observations exceeding a limit L, as in 2-2s, two consecutive observations beyond the same two-standard-deviation line 4.
| Rule | Violation | Mainly indicates | Typical action |
|---|---|---|---|
| 1-2s | One result beyond mean ± 2s | Warning only; not a rejection rule in the original procedure | Inspect the data against the other rules |
| 1-3s | One result beyond mean ± 3s | Random error, or a large systematic error | Stop; investigate before reporting |
| 2-2s | Two consecutive results beyond the same ± 2s line | Systematic error | Stop; investigate |
| R-4s | In one run, one result above + 2s and another below − 2s | Random error; interpreted within a run only | Stop; investigate |
| 4-1s | Four consecutive results beyond the same ± 1s line | Systematic error, early shift | Investigate; correct |
| 10x | Ten consecutive results on one side of the mean | Systematic error, sustained shift | Investigate; correct |
The page that defines the procedure lists further variants for other numbers of control materials: 2of3-2s, 3-1s, 6x, 7T, 8x, 9x and 12x 4. Two points matter for a laboratory adopting them. First, in the classic manual version 1-2s is the trigger that tells the analyst to apply the others; modern software applies all rules at once and drops that gating 4. Second, the rule set was built for runs with two to four control measurements, so some rules mean different things when there is one value per run 4.
Every added rule raises sensitivity to a shift and raises the false-alarm rate. For the zone rules used in industry, the average interval between false alarms falls from about 371 points for the plain chart to roughly 92 when the full supplementary set is applied 1. More rules is not better control; it is more investigations. Choose the set that matches the cost of missing a shift against the cost of chasing noise.
A worked series: reading rule violations
Eleven further retention times follow the 20-point baseline, with standardised distance from the mean in units of s = 0.0396 min. The series is invented: a slow downward drift of the kind produced by a gradual change in column condition or mobile-phase composition.
| Point | Retention time, min | Distance, s | Rule violated |
|---|---|---|---|
| 21 | 12.43 | +0.23 | None |
| 22 | 12.40 | −0.53 | None |
| 23 | 12.46 | +0.99 | None |
| 24 | 12.38 | −1.04 | None |
| 25 | 12.36 | −1.54 | None |
| 26 | 12.37 | −1.29 | None |
| 27 | 12.34 | −2.05 | 1-2s warning; 4-1s (points 24 to 27 all below −1s) |
| 28 | 12.38 | −1.04 | 4-1s continues |
| 29 | 12.35 | −1.79 | 4-1s continues |
| 30 | 12.33 | −2.30 | 4-1s continues |
| 31 | 12.30 | −3.06 | 1-3s; 2-2s (points 30 and 31) |
Every one of these eleven results sits inside a fixed retention window of 12.0 to 13.0 minutes, so every run passed its SST. The chart flagged the problem at point 27, four points before the first action-limit breach, because four consecutive results had fallen below the −1s line. Acting at point 27 means checking the mobile phase, the column and the pump while the system still passes; acting at point 31 means the same checks after the series has crossed the action limit. The first is maintenance, the second is an investigation.
Which SST parameters to trend
| Parameter | Chart type | Movement | Typical cause to check first |
|---|---|---|---|
| Retention time, main peak | Individuals | Steady decrease | Column ageing or stationary-phase loss; mobile-phase organic fraction high |
| Retention time, main peak | Individuals | Sudden step | New mobile-phase batch, new column, flow or temperature change |
| Resolution of the critical pair | Individuals | Falling | Column ageing, mobile-phase pH or ion-pair concentration drift |
| Tailing factor | Individuals | Rising | Column bed or frit change, secondary interactions, dead volume |
| Area RSD of replicate injections | Individuals, upper limit most useful | Rising | Injector wear, air in lines, sample adsorption, detector lamp |
| Check-standard recovery | Individuals | Drift or step | Standard degradation, preparation change, detector response |
Plate count is the awkward one. It depends on the integration method and is noisy even when nothing has changed, which makes its limits wide and its alarms rare. Chart it if the baseline is stable; otherwise let resolution and tailing carry the information. For parameters where only one direction matters, such as area RSD, the upper limit is the working one and the lower limit is not an alarm.
Trends, shifts and drift: what each points to
- Shift: a step change that then holds, so that the points sit on one side of the old mean. It usually follows a discrete event: a new column, new mobile phase, new lamp, new standard lot. Look in the log for the event.
- Drift: a gradual movement. It follows a progressive cause: column ageing, evaporation of mobile phase, a degrading standard, a failing lamp.
- Rising scatter: points staying near the mean but spreading. It points at precision, such as the injector, sample stability or an analyst difference.
- Single outlier: one point alone beyond a limit. Repeat the measurement once under the SOP, record both results, and investigate if it recurs; do not delete it.
Pure trend rules, such as six or seven results moving in the same direction, are listed in industrial practice, but the originating authors do not include seven-point trend in the Westgard set, and the chart in the previous section would not have been caught by it at all, since a noisy drift rarely produces seven successive monotonic steps 14. Rules based on counts above or below the mean are the more reliable detectors of a slow drift.
Recalculating limits after a method or column change
Limits describe a system. If the system is deliberately changed, the old limits no longer apply. If it changes without being told, a new baseline is a way of hiding the change.
- Document the change under change control: new column lot, new instrument, revised method, replaced detector lamp.
- Decide whether the change is expected to move the parameter. A new lot of the same column type may not; a different manufacturer's column will.
- Continue plotting against the old limits for the first points. A shift that exceeds the old limits after a planned change is information about the change.
- Collect a new set of at least 20 results under the new conditions, with the same selection discipline as the first baseline.
- Calculate new limits, mark the change on the chart as a vertical line with its reference, and archive the old chart.
- Do not recalculate in response to an alarm. Limits are revised after a cause is identified and accepted, never to remove the alarm.
The trending record and review frequency
A chart nobody reviews is decoration. Name the reviewer and the frequency in the SOP, and keep the review itself as a record.
| Item | Content |
|---|---|
| Identification | Parameter, method, instrument, material, units |
| Baseline | The 20 or more points, dates, mean, standard deviation, any points removed with the reason |
| Rule set | Which rules are in force, and the response to each |
| Each point | Date, run identifier, value, analyst |
| Violations | Rule, investigation, cause, corrective action, closure |
| Changes | Column, lamp, standard lot, method revision, with dates, marked on the chart |
| Review | Reviewer, date and outcome, at the stated frequency |
For a laboratory running a few sequences a week, review every chart weekly and after any alarm; for a laboratory running daily, review when each point is plotted and formally at a set interval. The right interval is the shortest one at which a shift could do damage before it was found: if a week's worth of results would be unusable, review more often than weekly.
Chart-construction procedure
- Select the parameter, material and instrument; record them.
- Collect 20 or more in-control results over several days and preparations.
- Examine them; remove only points with a documented assignable cause.
- Compute the mean and sample standard deviation.
- Draw the centre line and ±1s, ±2s, ±3s lines.
- Plot the baseline to confirm it sits inside its own limits.
- Write the rule set and the response to each violation.
- Plot each new result as it is obtained; apply the rules to the series, not only to the latest point.
- On a violation, investigate before accepting further runs, and record the cause.
- After a documented change, collect a new baseline and set new limits; never after an alarm alone.
- Review on the stated frequency and record the review.
References
- 6.3.2 What are variables control charts? In: NIST/SEMATECH e-Handbook of Statistical Methods
- The use of control charts in the clinical laboratory
- A multi-rule Shewhart chart for quality control in clinical chemistry
- Westgard Rules | Multirules by James Westgard
- C24: Statistical Quality Control for Quantitative Measurement Procedures: Principles and Definitions, 4th Edition
- ISO 7870-2:2023 Control charts — Part 2: Shewhart control charts