Formulation and lyophilisation
Lab Freeze-Drying: Tg', Collapse Temperature and the Cycle
How Tg' and the collapse temperature are measured, how they set the product-temperature target, and how shelf temperature and chamber pressure follow from it. A cycle-design procedure for a laboratory freeze-dryer with a parameter table and a run record.
Tg′ and the collapse temperature are measured on the frozen formulation, by differential scanning calorimetry and by freeze-drying microscopy respectively, and the product temperature during primary drying is held a few kelvin below the lower of the two. Shelf temperature and chamber pressure are then chosen so that the product sits at that target: the pressure sets the sublimation rate, the shelf supplies the heat, and the product temperature is the result of the balance between them 12.
This page is the cycle-design arithmetic for research-material formulations dried in a laboratory freeze-dryer. It covers the three temperatures, how each is measured, the chamber pressure against ice vapour pressure, end-point signals, secondary drying, and the run record. The cycle table at the foot is a template; the numbers in it are placeholders for a generic amorphous peptide formulation with a Tg′ of −32 °C.
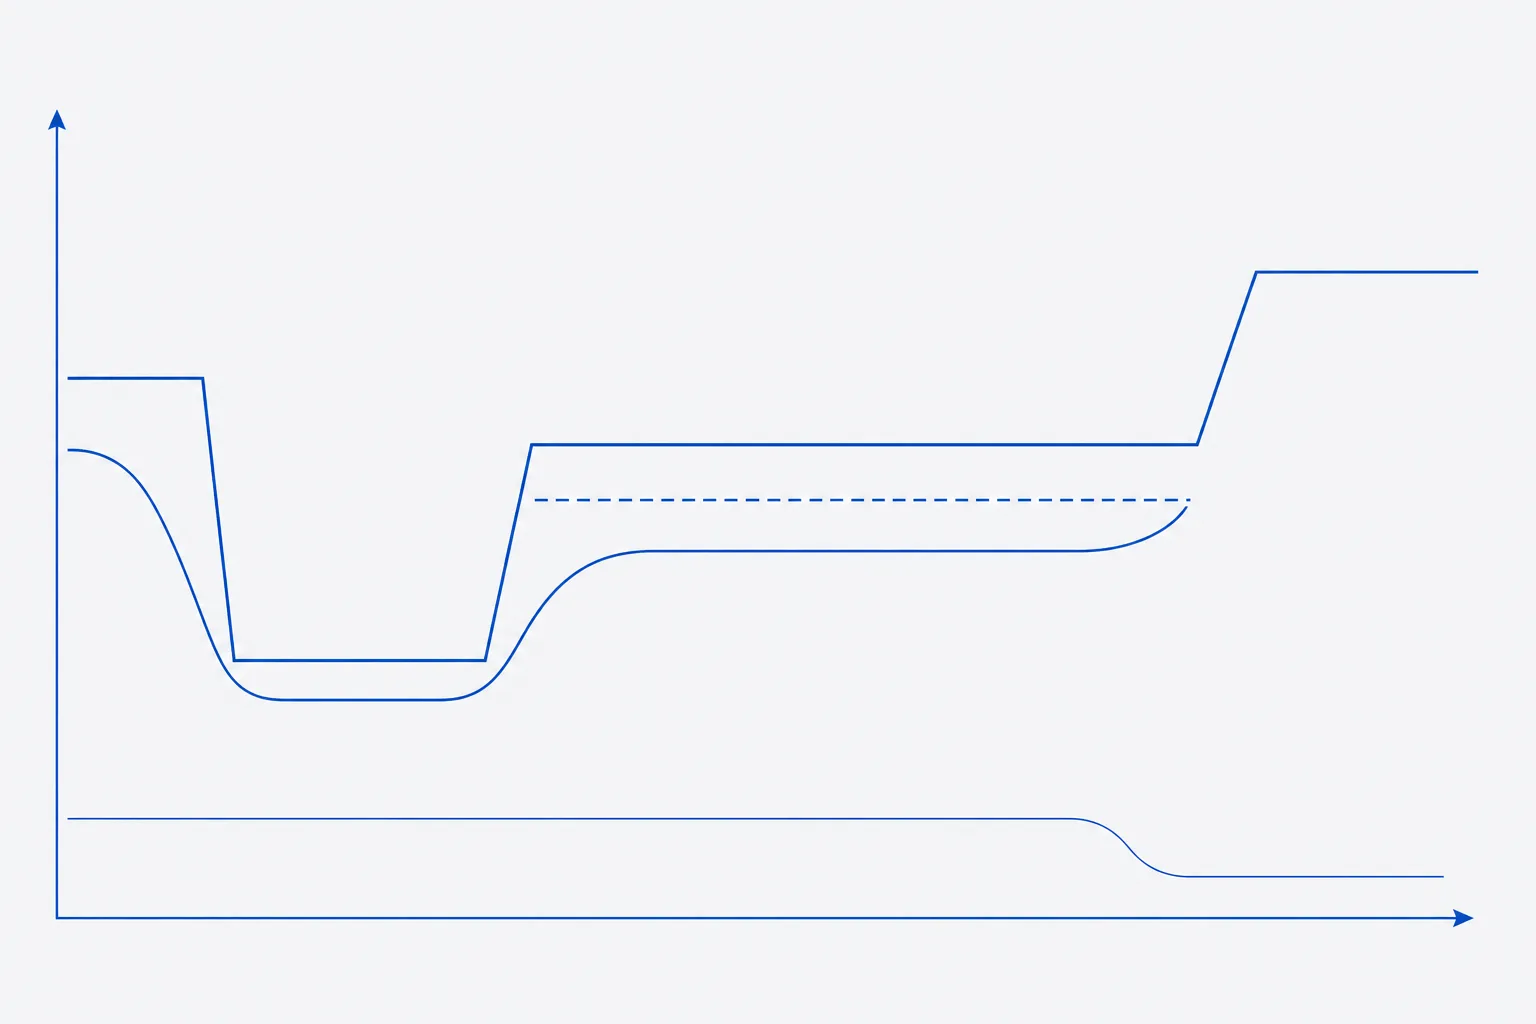
Three temperatures: Tg′, Tc and the dried-product Tg
On freezing, ice separates and the solutes concentrate into a viscous unfrozen phase. Tg′ is the glass transition temperature of that freeze-concentrate. Below it the concentrate is a rigid glass; above it, it softens and flows. The collapse temperature Tc is the temperature above which a freeze-dried structure loses macroscopic form during drying; it lies a few degrees above Tg′ because the viscous matrix needs time and a margin of softness before it visibly fails 34.
The third temperature belongs to the dried solid. The glass transition of the dried product depends on its residual water: each additional per cent of water lowers it by roughly the order of ten degrees, so a cake dried to 1% water and one at 4% have very different storage tolerance 1. For a crystalline excipient the relevant limit is not Tg′ but the eutectic temperature, which is far higher. FDA's inspection guide expresses the same constraint in older language: product frozen well below its eutectic point, and held 4 to 5 degrees below it during primary drying 8.
Measuring Tg′ by DSC and Tc by freeze-drying microscopy
In a DSC measurement a few milligrams of the formulation solution are sealed in a pan, cooled to about −70 °C and warmed at a controlled rate, commonly 1 to 5 K per minute. The glass transition appears as a step in heat flow. Because the step is small and often overlaps an ice-melting endotherm, it is read from the midpoint on the heating curve, and an annealing step is often added to cause ice to crystallise fully and sharpen the transition. Searles and colleagues showed that annealing both optimises the drying rate and makes Tg′ detectable in systems where it is otherwise obscured 5.
Freeze-drying microscopy puts a thin film of the solution on a cold stage under vacuum, freezes it, and heats it slowly while a drying front advances through the sample. The collapse temperature is recorded as the stage temperature at which the dried region behind the front loses its structure. Pikal and Shah showed that Tc depends strongly on how it is measured, including the heating rate, the criterion for collapse and the thickness of the film, and the true collapse temperature in a vial is a range, not a point 3. Meister and Gieseler compared microscopy collapse temperatures with DSC glass transitions for protein–sugar mixtures and found Tc lay a few degrees above Tg′ with a method-dependent spread 4.
| Quantity | Method | Sample | Read from | Typical uncertainty |
|---|---|---|---|---|
| Tg′ | DSC, heating 1 to 5 K per minute, with or without annealing | 10 to 20 µL of formulation in a sealed pan | Midpoint of the heat-flow step | ±1 K; larger if the step is weak |
| Tc | Freeze-drying microscopy | A few microlitres as a thin film under vacuum | Stage temperature at onset of structure loss | ±2 K; depends on criterion and rate |
| Eutectic temperature | DSC or impedance analysis | As above | Melting endotherm onset | ±1 K |
| Dried-product Tg | DSC on dried cake, sealed in dry atmosphere | 5 to 10 mg of cake | Midpoint of the step | ±2 K; falls as water rises |
Freezing and annealing: ice crystal size and mannitol
Freezing sets the pore structure. Fast freezing gives many small ice crystals and small pores that sublime slowly; slow freezing, or an annealing hold, gives larger crystals and larger pores that sublime faster. Random nucleation makes vials freeze at different degrees of supercooling, and the resulting differences in pore size are a principal source of vial-to-vial variation in drying time. Searles and colleagues describe annealing as a way to reduce that heterogeneity 5.
For a formulation containing a crystallising bulking agent such as mannitol, an annealing hold is also what completes its crystallisation before drying. The hold is set above Tg′ and below the eutectic temperature, commonly around −20 °C for a few hours, then the shelf is cooled again to the freezing floor. An amorphous-only formulation is annealed at a temperature just above Tg′ for a shorter time, or not at all, because prolonged time above Tg′ can let the matrix begin to relax 2. Hold the freezing temperature for long enough that every vial, including the one with the thermocouple, has reached the shelf value.
Primary drying: shelf temperature, pressure and the product-temperature margin
During primary drying the ice sublimes from the top of the frozen plug downward. The product temperature at the sublimation front is set by a balance: heat comes in from the shelf through the vial base and glass, and heat leaves as the latent heat of sublimation. Raising the chamber pressure raises the product temperature at the front; raising the shelf temperature does the same. The design goal is to hold the product temperature at the target, 2 to 3 K below Tc, so that the structure is never at risk while the drying is as fast as that limit permits 12.
Chamber pressure must stay below the vapour pressure of ice at the target product temperature, or the ice does not sublime. The vapour pressure of ice is a tabulated function of temperature 7. Approximate values are 260 Pa at −10 °C, 103 Pa at −20 °C, 38 Pa at −30 °C and 13 Pa at −40 °C. For a target of −34 °C the vapour pressure is about 25 Pa. A chamber pressure well below that, commonly a third to a half of it in practice, leaves a driving force for sublimation without driving the product temperature up to the limit. Run the first cycle with a conservative pressure and a modest shelf temperature, then raise them in steps while watching the product-temperature probe.
| Product temperature, °C | Ice vapour pressure, Pa | Chamber pressure range, Pa |
|---|---|---|
| −40 | 13 | 4 to 6 |
| −35 | 22 | 7 to 11 |
| −30 | 38 | 13 to 19 |
| −25 | 63 | 21 to 32 |
| −20 | 103 | 34 to 52 |
End-point signals for primary drying
Primary drying ends when the last ice has gone, and that must be shown, not assumed from elapsed time. Patel and colleagues review the signals available 6. The product-temperature probe rises toward the shelf temperature as sublimation stops. The Pirani gauge, which reads higher than a capacitance manometer when water vapour is present, falls to meet it. The chamber pressure, with the isolation valve closed briefly, stops rising. Each signal is blind to something, and the most reliable practice is to require two to agree 6.
The end of primary drying for the whole batch is later than the end for the probe vial. Add a margin, commonly an hour or more beyond the last signal, before raising the shelf into secondary drying. Beginning secondary drying while ice remains in some vials is the commonest cause of meltback.
Secondary drying and residual moisture target
After the ice has gone, the cake still holds water sorbed on the solid, typically several per cent. Secondary drying removes it at a raised shelf temperature and the same low pressure. The shelf is ramped slowly, about 0.1 to 0.3 K per minute, to avoid heating the cake above the glass transition of the partly dried solid, and held at 20 to 40 °C for several hours 1. The residual water target for peptide material is commonly 1% or less, set from stability data for the formulation. FDA's inspection guide gives no numeric limit and says moisture specifications should be supported by data and by the worst-case, higher-moisture batches 8.
The ramp rate matters because the dried-product glass transition rises as the water falls. A cake at 5% water may have a glass transition near the secondary-drying temperature; a fast ramp to the final shelf value can soften the cake, shrink the pores and trap water inside. Confirm the result by Karl Fischer titration on whole vials.
Stoppering, backfill and vacuum
At the end of the cycle the vials are closed under vacuum or after backfill with dry nitrogen, stoppers seated by the shelf-stoppering mechanism before the chamber is vented. FDA's guide notes the importance of stopper placement and of controlling the final steps of the cycle 8. The aim is a dry headspace and a closure that does not take up water afterwards: rubber stoppers carry sorbed water, and unless they are dried they release it into the dry cake over time. Specify stopper drying in the procedure and record the stopper lot.
The run record and what to compare between batches
| Stage | Shelf temperature | Chamber pressure | Duration | End-point signal |
|---|---|---|---|---|
| Loading and equilibration | 5 °C | Atmospheric | 30 min | Probe within 1 K of shelf |
| Freezing ramp | 5 to −45 °C at 0.5 K per minute | Atmospheric | 100 min | Probe at −40 °C or lower |
| Freezing hold | −45 °C | Atmospheric | 120 min | All probes constant |
| Annealing, if mannitol or glycine is present | −20 °C | Atmospheric | 180 min | Hold complete; cool back to −45 °C |
| Primary drying | −25 °C | 10 Pa | Until two end-point signals agree | Probe rise; Pirani meets capacitance gauge; no pressure rise |
| Secondary drying ramp | −25 to 30 °C at 0.2 K per minute | 10 Pa | 275 min | Probe tracks shelf |
| Secondary drying hold | 30 °C | 10 Pa | 6 h | Karl Fischer on whole vials ≤ 1% |
| Stoppering and unload | 20 °C | Vacuum or dry nitrogen backfill | As required | Stoppers seated; seal integrity |
- Measure Tg′ by DSC on the exact formulation, with and without annealing, and Tc by freeze-drying microscopy. Record the method, rate and criterion.
- Set the target product temperature 2 to 3 K below Tc, or below the eutectic temperature for a crystalline matrix, and take the lower value if both phases are present.
- Look up the ice vapour pressure at that temperature and choose a chamber pressure a third to a half of it.
- Choose the shelf temperature from experience of the dryer, start low, and raise it in steps over successive runs until the probe reads the target.
- Define the end of primary drying by two agreeing signals plus a stated margin, and write that rule in the procedure before the run.
- Ramp slowly into secondary drying and hold to the moisture target, confirmed by Karl Fischer on whole vials from several shelf positions.
- Archive the shelf, product and pressure traces with the lot record, together with Tg′, Tc, the cycle table as run, and any alarm or deviation.
- When comparing batches, compare the traces, the primary drying time to end-point, the residual water by shelf position, and the cake grades, not the cycle summary alone.
Cycle design is an iterative loop: the formulation fixes the temperature limits, the limits fix the target, and the dryer is tuned until the target is met. Because the record is the only evidence of what the product experienced, a cycle that gave an acceptable cake once but was not recorded cannot be repeated 12.
References
- Design of freeze-drying processes for pharmaceuticals: practical advice
- Practical Advice on Scientific Design of Freeze-Drying Process: 2023 Update
- The collapse temperature in freeze drying: Dependence on measurement methodology and rate of water removal from the glassy phase
- Freeze-Dry Microscopy of Protein/Sugar Mixtures: Drying Behavior, Interpretation of Collapse Temperatures and a Comparison to Corresponding Glass Transition Data
- Annealing to optimize the primary drying rate, reduce freezing-induced drying rate heterogeneity, and determine T(g)' in pharmaceutical lyophilization
- Determination of end point of primary drying in freeze-drying process control
- Review of the vapour pressures of ice and supercooled water for atmospheric applications
- Guide to Inspections of Lyophilization of Parenterals (7/93)