instrumentation
pH Meter Calibration and Electrode Care: Brackets, Slope, Offset and Junctions
A pH reading is a millivolt measurement dressed as a number. How to choose calibration brackets, read slope and offset as electrode health, compensate for temperature, and keep a junction working — and why a tenth of a unit changes a peptide's degradation rate.
A pH meter does not measure pH. It measures a potential difference, in millivolts, between a glass membrane responding to hydrogen ion activity and a reference half-cell held at a fixed potential through a porous liquid junction. Calibration is the act of fitting a straight line to that potential using buffers of assigned value, and everything that goes wrong with a pH measurement goes wrong with either the line or the junction 1. Reading the two parameters of that line — slope and offset — is the entire diagnostic repertoire, and both are displayed by any instrument worth using.
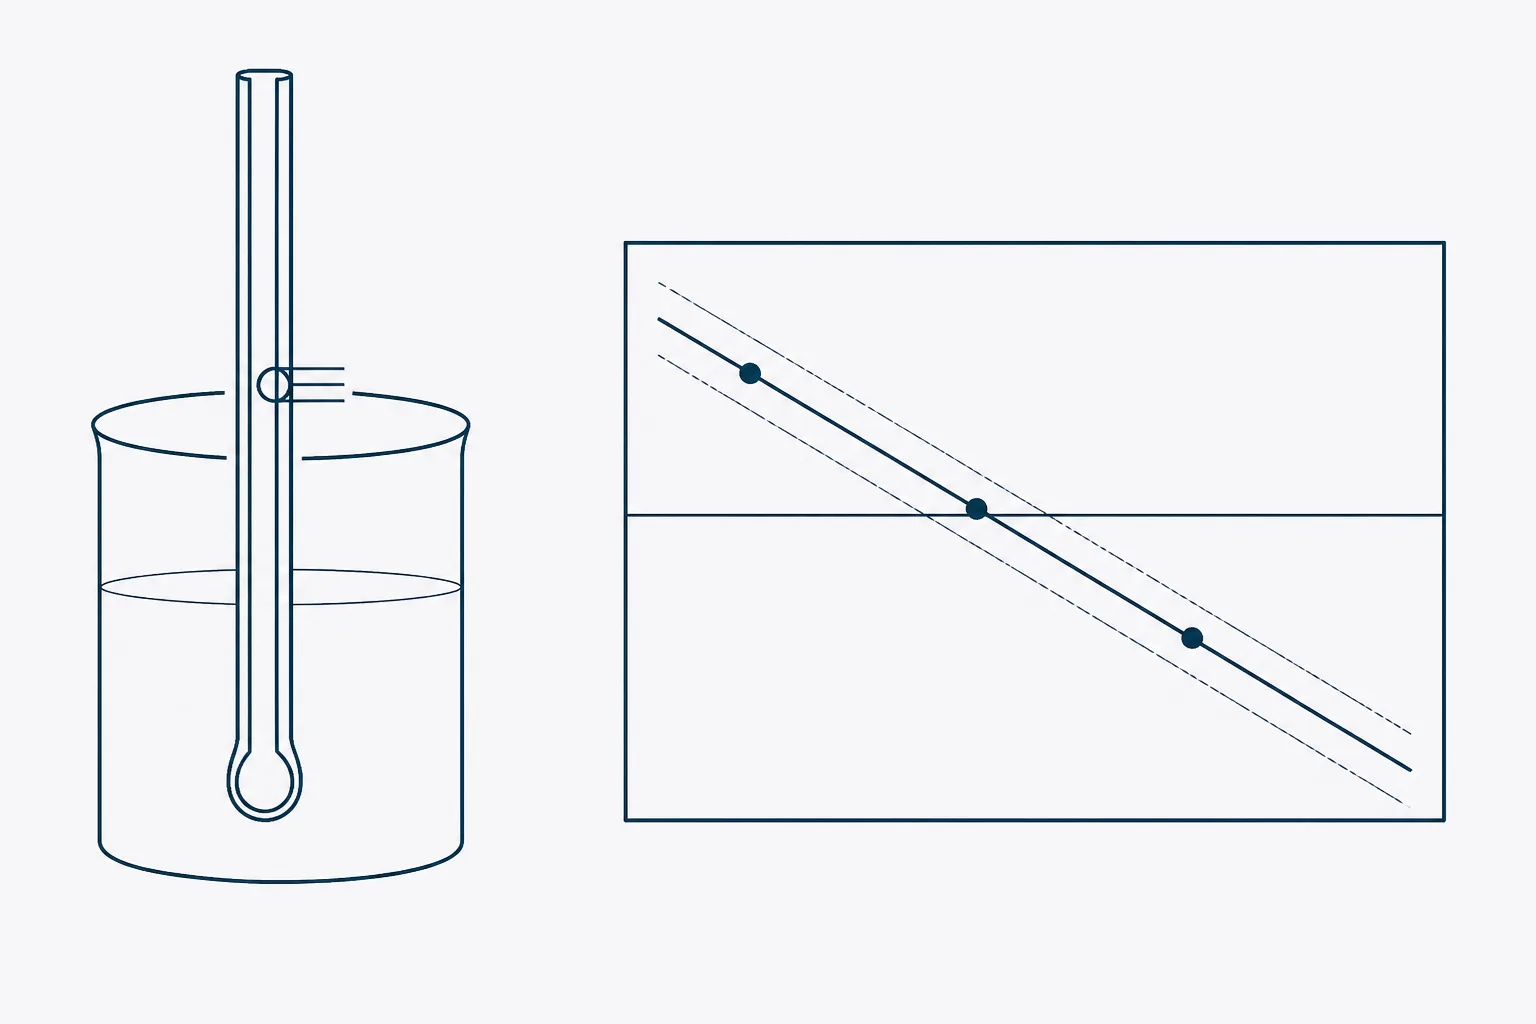
Two-point and three-point calibration
A single-point calibration sets the offset and assumes the slope. It is a zeroing operation, adequate only for confirming that a recently calibrated instrument has not shifted. Two points define the line: one buffer near neutral to fix the offset and a second on the side of the scale where the sample lies, to fix the slope. Three points add a check on linearity across the working range and give a middle value that can be treated as a verification rather than an input 1.
Bracketing is the rule that matters. The buffers should straddle the expected sample value, because between them the fitted line is interpolated and beyond them it is extrapolated. A meter calibrated at pH 7.00 and pH 10.01 and then used to read an acetate buffer near pH 4 is being asked to predict a region it has never seen, and any curvature in the electrode response appears there in full.
| Sample region | Buffers | Notes |
|---|---|---|
| pH 3 to 6 | 4.01 and 7.00 | The common case for acetate and citrate systems |
| pH 6 to 8 | 4.01 and 7.00, or 7.00 and 10.01 | Choose the pair that straddles the target |
| pH 8 to 11 | 7.00 and 10.01 | Alkaline error grows above pH 11 on ordinary glass |
| Wide or unknown range | 4.01, 7.00 and 10.01 | Three points, with the middle read back as a check |
| Below pH 2 or above pH 12 | Specialist buffers and glass | Ordinary electrodes are outside their linear region |
- Bring buffers and sample to the same temperature and let them settle. Decant fresh buffer into a clean beaker and never return it to the bottle.
- Rinse the electrode with deionised water, then blot — do not wipe — with lint-free tissue. Wiping charges the glass and lengthens the settling time.
- Immerse so that the bulb and the junction are both below the liquid surface. A junction in air is not a reference.
- Stir gently and identically in every buffer and in the sample, because the junction potential depends on flow.
- Wait for the stability indicator rather than for a fixed count; record how long each point took to settle.
- Repeat for the second and, where used, third buffer, rinsing between each.
- Read the slope and offset the instrument reports and enter both in the log with the buffer lot and the temperature.
- Verify by measuring a fresh aliquot of the middle buffer as an unknown, and accept only if it reads within the tolerance set for the work.
Slope and offset as electrode health
Slope is the millivolts the electrode produces per unit of pH. The theoretical value at 25 degrees Celsius is about 59.2 mV per pH unit, and instruments report the measured value as a percentage of that 1. A slope between 95 and 105 per cent is normal service. Between 90 and 95 per cent the electrode is ageing and should be conditioned and re-tested. Below 90 per cent it is finished for accurate work, whatever the display shows afterwards, because the instrument will still calibrate and still return numbers.
Offset is the potential the cell produces in pH 7 buffer, where a perfect electrode would produce zero. Within about 15 mV is healthy; out to 30 mV is acceptable with attention; beyond that the reference half-cell or the junction has changed and the calibration is compensating for a fault rather than characterising an instrument. The two parameters fail in different ways, which is what makes them useful together.
| Observation | Most likely cause | First action |
|---|---|---|
| Slope falling gradually over months | Normal ageing of the glass membrane | Condition in acidic potassium chloride; plan replacement |
| Slope drops abruptly | Membrane fouled by protein or coated by sample | Protein-removal or acid clean, then recalibrate |
| Offset large, slope normal | Reference half-cell drifting or electrolyte depleted | Refill the reference chamber; re-test |
| Both slope and offset out | Junction blocked, or the electrode has dried | Soak in storage solution; clean the junction |
| Readings slow but calibration passes | Partially blocked junction | Warm potassium chloride soak; verify response time |
| Reading drifts continuously in sample only | Low ionic strength or a sample that attacks the glass | Add inert electrolyte, or use a low-ionic-strength electrode |
Response time belongs alongside them as a third, unreported parameter. A healthy general-purpose electrode reaches a stable reading in well under a minute in a well-buffered solution. An electrode that takes several minutes has a transport problem at the junction or a hydrated layer that has degraded, and it will read low in one direction and high in the other depending on which solution it saw last. Recording settling time at each calibration turns a subjective impression into a trend.
Temperature compensation and what it does not cover
Temperature enters a pH measurement twice, and automatic temperature compensation addresses only one of the two entries. The first is the electrode response itself: the slope is proportional to absolute temperature, so the millivolts per pH unit rise as the solution warms. This is deterministic, and the meter's temperature probe corrects it exactly 1.
The second is the pH of the solution being measured, which is a chemical property that changes with temperature because the equilibria in it change. No compensation circuit can correct this, because the meter has no way of knowing what is dissolved. A phosphate buffer and a tris buffer at nominally the same pH move in different directions and by different amounts as they warm, and tris moves a great deal. The consequence is simple and often missed: a solution adjusted to a target at bench temperature is not at that target when it is used cold, and a buffer prepared at 25 degrees Celsius and used at 4 degrees may sit most of a unit away.
Two rules follow. Calibrate and measure at the same temperature, using buffer temperature values from the table printed on the buffer bottle rather than the nominal value. And where a solution will be used at a different temperature from the one at which it was prepared, adjust it at the temperature of use, or record both the preparation temperature and the expected shift so the discrepancy is documented rather than discovered 4.
Storage, junctions and the end of an electrode
A glass pH electrode works through a hydrated gel layer, a few tens of nanometres thick, on the outer surface of the membrane. That layer is the sensing element. It forms slowly when the electrode is wetted and it collapses when the electrode dries, and although a dried electrode can often be recovered by soaking, it does not recover fully and its slope rarely returns to where it was.
- Store in the manufacturer's storage solution, or in 3 molar potassium chloride, with the cap filled and seated.
- Never store in distilled or deionised water. It leaches ions out of the gel layer and out of the junction, and it is the fastest way to ruin an electrode short of dropping it.
- Never store dry, and never leave an electrode standing in a sample between measurements.
- Keep the reference filling hole open while measuring and closed while stored, so the electrolyte flows outward rather than the sample flowing in.
- Keep the electrolyte level above the sample level, so the pressure gradient runs outward across the junction.
- Rinse and blot between every solution, and give the electrode a longer conditioning soak after any protein-containing sample.
The junction is the part that actually fails first in most laboratories. It is a small porous frit, or a ground sleeve, through which reference electrolyte flows slowly outward to complete the circuit. Anything that clogs it — precipitated protein, silver chloride crystallising out of the reference, sulphide, a viscous sample, or a peptide adsorbing onto the frit — raises its resistance and destabilises the junction potential. The symptoms are slow response, drift that never settles, and readings that depend on how vigorously the solution is stirred.
Cleaning is matched to the deposit: dilute acid for carbonate and inorganic scale, a proteolytic cleaning solution for protein films, a brief soak in thiourea for silver chloride blockage, and a warm potassium chloride soak as the general restorative. Cleaning is always followed by re-conditioning and a full recalibration, because both parameters will have moved. An electrode is finished when the slope stays below about 90 per cent after conditioning, when the offset cannot be brought inside tolerance, when response time remains minutes rather than seconds, or when the membrane or the stem is visibly cracked or crazed. Electrodes are consumables with a service life of roughly one to two years in regular use, and running one past its endpoint does not save money; it silently corrupts everything measured with it.
Why a tenth of a unit matters to a peptide
The reason to care about a 0.1 unit calibration error is that peptide degradation rates are pH-dependent over the range where buffers are actually prepared. Deamidation of asparagine is the clearest case. In a model hexapeptide the rate against pH traces a curve with a shallow minimum in the mildly acidic region and rises steeply on either side; between roughly pH 5 and pH 12 the reaction proceeds through a cyclic imide intermediate, which then opens to give a mixture of the aspartyl and isoaspartyl products 2. Below the minimum, direct acid hydrolysis of the side-chain amide takes over instead.
That mechanism is why the sensitivity is not linear. The rate-limiting step above the minimum is deprotonation of the following backbone amide nitrogen, so the reaction accelerates roughly in proportion to hydroxide concentration — an order of magnitude for each unit of pH. A buffer that was meant to sit at pH 6.0 and in fact sits at pH 6.3, because the meter was calibrated against a tired electrode, is not three per cent wrong in its degradation rate. Sequence sets how much this costs: an asparagine followed by glycine deamidates far faster than the same residue followed by a bulky side chain, so identical pH error produces very different losses in different peptides 3.
The same argument applies to the other pH-sensitive routes: aspartate isomerisation, backbone hydrolysis at acidic residues, disulphide scrambling and thiol oxidation all have pH dependences of their own, and formulation pH is generally chosen as a compromise between them rather than as an optimum for any one 4. That compromise is only as real as the number the meter produced. A calibration record showing slope, offset, buffer lot and temperature converts a pH figure from an assertion into a measurement, and it is the only part of a stability study that can be checked after the fact.
References
- Measurement of pH. Definition, standards, and procedures (IUPAC Recommendations 2002)
- Chemical pathways of peptide degradation. II. Kinetics of deamidation of an asparaginyl residue in a model hexapeptide
- Chemical pathways of peptide degradation. III. Effect of primary sequence on the pathways of deamidation of asparaginyl residues in hexapeptides
- Stability of protein pharmaceuticals: an update